The Souq: Value Creation and Extraction in OpenRouter
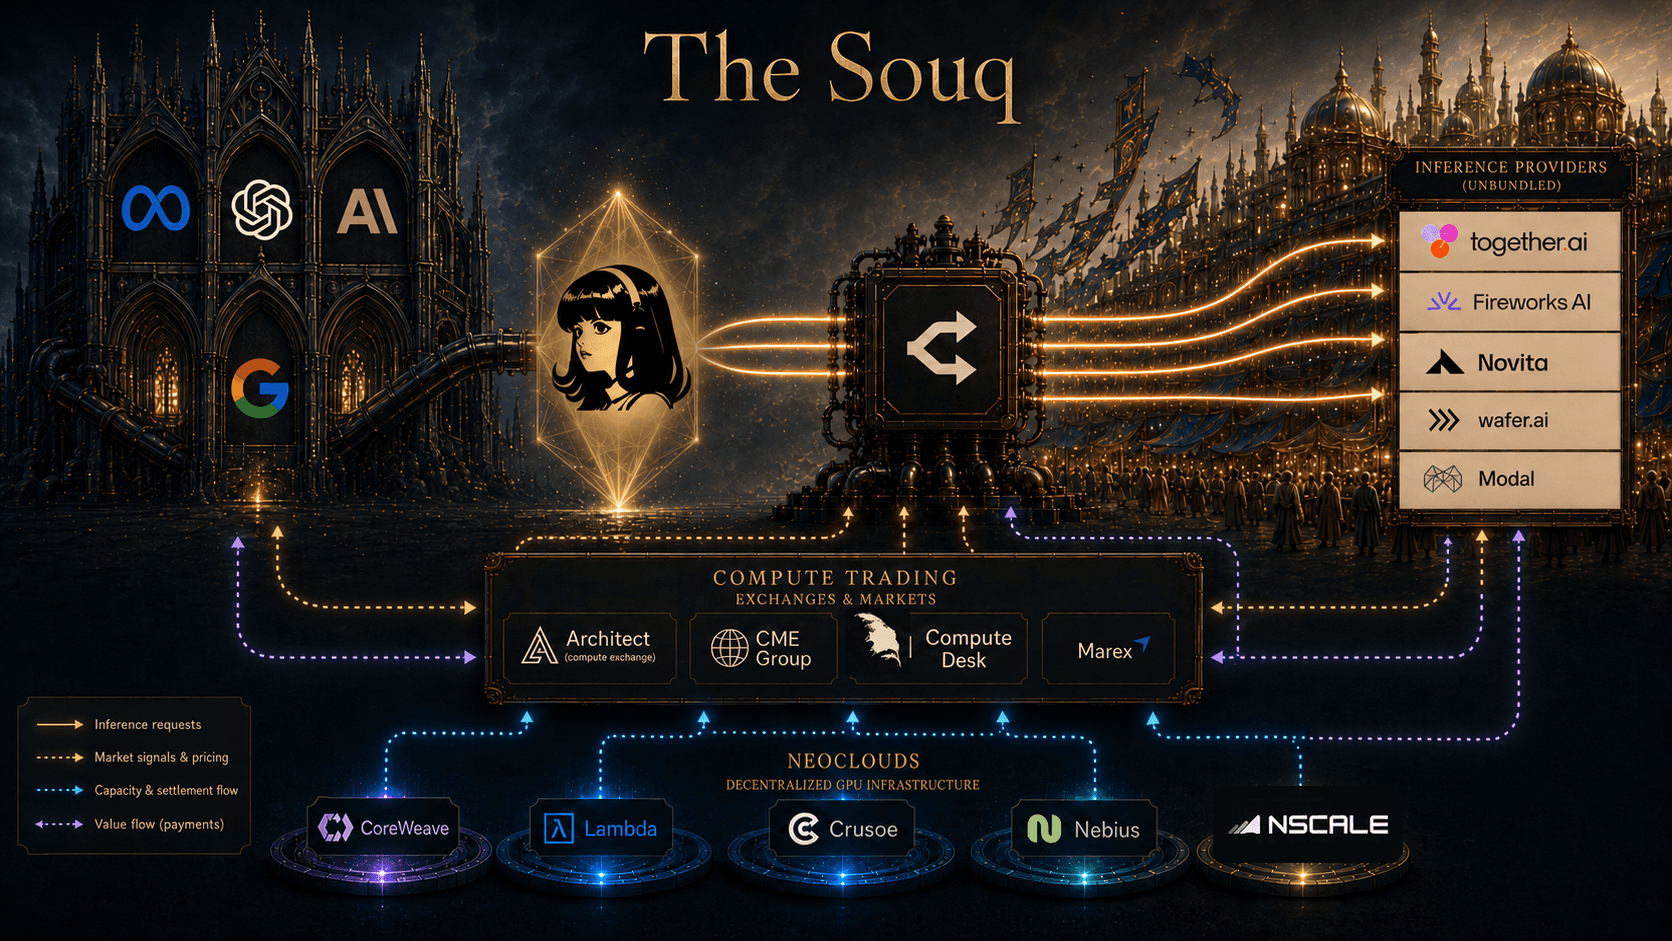
Open source software has undergone many economic revolutions in the last 30 years. However, none of the prior revolutions created fundamentally new market structures like what we see with open weight models today. In this first post of three, we analyze these markets from two complementary lenses:
Unbundling of closed source markets
Strategic, multi-agent game played to monetize token order flow
The first lens provides a philosophical view on why such markets developed organically. The second frame, by contrast, allows us to empirically analyze the incentives of the numerous economic actors in the open weight ecosystem — users, harnesses, routers, model builders, and inference providers.
This framing leads us to three key questions:
Are there any economic actors who are manipulating pricing and/or supply to gain an unfair profit?
How do the input costs (electricity, GPUs, etc.) connect to the final output cost (price per token)?
What is the long-term equilibrium? And in this equilibrium, which actors earn outsized value?
This post analyzes the first question using public OpenRouter data. We, perhaps surprisingly, find evidence of strategic price manipulation by inference providers, loosely akin to spoofing in traditional finance, Maximal Extractable Value in blockchains, and quality shading in online ads.
But first, before we dive into the data, we’ll look back at the history of open source as a fundamental unbundling of information goods. This sets the economic stage for the game played by open weight market participants.
Cathedrals and Bazaars
In 1997, Linux developer Eric S. Raymond wrote his famous essay, “The Cathedral and the Bazaar,” which portended one of the first big economic changes for open source software. The cathedral represents centralized software development from a core team that doesn’t allow for arbitrary contributions. Such groups include both closed source software development and some very tightly controlled open source software that didn’t allow for arbitrary outside contribution (GTK, GNU). The dual to the cathedral was the bazaar, which represented arbitrary contributions and crowd-sourced developments. Linux is the archetypal example of software in this category.
So why did this delineate the first economic revolution of open source software? Much of the pre-cloud internet rewarded cathedral style development. However, once companies moved from the “I own my servers” to the “I rent my servers” distribution model of the cloud, portable, modular, and robust software became more valuable than integrated software. This naturally led to investment in financing the development costs of the bazaar.
The bazaar might at first glance seem chaotic and expensive. However, it was later observed in practice that for critical software like Linux, open source allows for “sunlight to be the best disinfectant.” Code was able to have more eyeballs on it, with independent developers scanning for critical bugs. Moreover, many organizations found it cheaper to contribute to and use open source code than solely maintain code via in-house development. This created a cheaper cost of entry for new participants and moved the consumption software to the usage-based payment model of SaaS.
CapEx and OpEx
The economics of open source software prior to open weights models was predominantly an exercise in managing capital expenditure and reputation as a currency. Josh Lerner and Nobel Prize winner Jean Tirole’s seminal work on the economics of bazaar participants showed that status games and the ability to use one’s open source record as a resume matter just as much as payment for writing code. Over time, business models developed for funding open source development, ranging from non-profit foundations and grants to corporate sponsorship of open source contributors.
All of these models, however, focused on pricing the capital expenditure of paying for developer salaries and security audits. There was little thought put into the operating expenditures for open source software. While one clearly had to pay a cloud provider or for one’s own server costs to run an open source package like MySQL, these costs were often de minimis relative to the labor costs for the creation and maintenance of open source software.
Open weight models flip this logic on its head. The biggest costs for generating software in the open weights isn’t labor — it is paying for compute and its associated inputs. In this world, the CapEx (training) and OpEx (inference) are mainly capital and not labor. This means that the “OpEx is a corollary left to the user” aspect of open source software dissolves in the open weights world.
Modularity
Agentic AI usage has skyrocketed in 2026 as capabilities have approached expert-level for many human tasks. This usage has also led to a dramatic increase in the revenue and pricing power that the largest closed source model producers (OpenAI and Anthropic) have over their customers. In light of these ballooning costs, many enterprise AI users quickly went from “tokenmaxxing” to attempting to find cheaper ways to access comparable intelligence.
Cheaper intelligence arrived thanks to the modular nature of open weight models. Modularity refers to the idea that different components beyond the raw AI model (e.g. a transformer) are created and managed independently. When one uses an open weight model, you can decompose the execution into a number of modular components:
Harnesses: Manage a user’s data, context and state that is given to a model
Routers: Map a task or sequence of tasks generated by a harness to a set of models to use
Open Weight Models: Transformer model such as Kimi K3 or GLM-5.2
Inference Provider: Provides the compute and hardware to execute the router-selected model on the context provided by the harness
From an economics perspective, modularity can be viewed as the unbundling of an information good.[1]
This decomposition into different functions allows for separate teams to specialize in optimizing a certain portion of an agent. Harnesses, such as Nous Research’s Hermes agent — the largest application on OpenRouter, with 15–20% market share — focus on optimizing user experience and managing user preferences and skills. Inference providers, such as Together AI, focus on delivering cheap inference by optimizing GPU kernels and aggregating computational resources to lower costs. These teams can operate independently and build off of each other’s improvements to compound and achieve the seemingly exponential improvements in performance over the last year.
Together AI founder Vipul Ved Prakash recently wrote an excellent article, “The Economy of Tokens”, about how modularity has helped drive prices down by creating competition and distributing CapEx and OpEx costs amongst multiple parties. This distribution of costs and specialization is antipodal to the aggregated costs borne by a single frontier lab. Within each modular component, there are many market participants who compete to deliver the cheapest and/or highest quality version of the component. However, there is simultaneously coordination and collaboration between different components. As Prakash highlights, different open weight models and harnesses borrow techniques and algorithmic improvements from one another. This can only happen because of the bazaar-like nature of open source software, where contributions can be imported freely.
The Souq
This combination of collaboration across teams via open source bazaar-style development combined with Bertrand-style pricing competition to lower OpEx costs yields a novel market structure. We call this market structure the Souq. One can view it as a multi-agent game where economic agents specialize in one of the modular components and compete for the right to maximize token order flow. How do value and tokens flow through the different components?
From an economic perspective, the incentives for participants at each level are:
Harnesses: Maximize user retention and become the “front page” for user token generation. Harnesses are a consumer business — like a crypto wallet or fintech application — that relies on users trusting the harness to hold their private information. Harnesses earn income from users directly paying them to find inference providers, subscriptions, and payment-for-order flow relationships with routers. In the future, they also likely will be paid via applications or even advertising that wants to use their distribution.
Routers: Maximize applications that utilize the router to find inference providers and models. Routers charge fees based on the total tokens they route to inference providers and also can earn income via payment-for-order flow relationships with inference providers. However, to retain applications from competing routers, they will likely need to have rebates or even order flow payments. Routers are more of a B2B business, which is why you see everyone from Ramp to Stripe entering the space.
Model Builders: Maximize the distribution of their model to both consumers and businesses. Have no route to economic value capture beyond either being an inference provider (which is currently how DeepSeek, Minimax, and Z.ai make money)[2] or charging a licensing fee to inference providers. Kimi K3’s novel license that requires any model-serving business with more than $20m in revenue to negotiate a separate commercial agreement with them is the first explicit example of the latter model.[3] Model builders also incur the CapEx of model training.
Inference Providers: Maximize tokens received from routers and harnesses while minimizing execution costs. Execution costs can be minimized by better procurement of computational resources (energy, hardware) and optimization of open weight inference code (e.g. Together AI’s kernel optimizations such as FlashAttention or Wafer’s memory optimizations). This is the most operationally and capital-intensive portion of the open weight stack.
In the image below, we see how a single user’s tokens flow through these components and where value transfers are made. A core question is, “at equilibrium, how much value does each component capture?” We answer this fully in a subsequent post, but suffice it to say that value seems to concentrate at harnesses and inference providers.
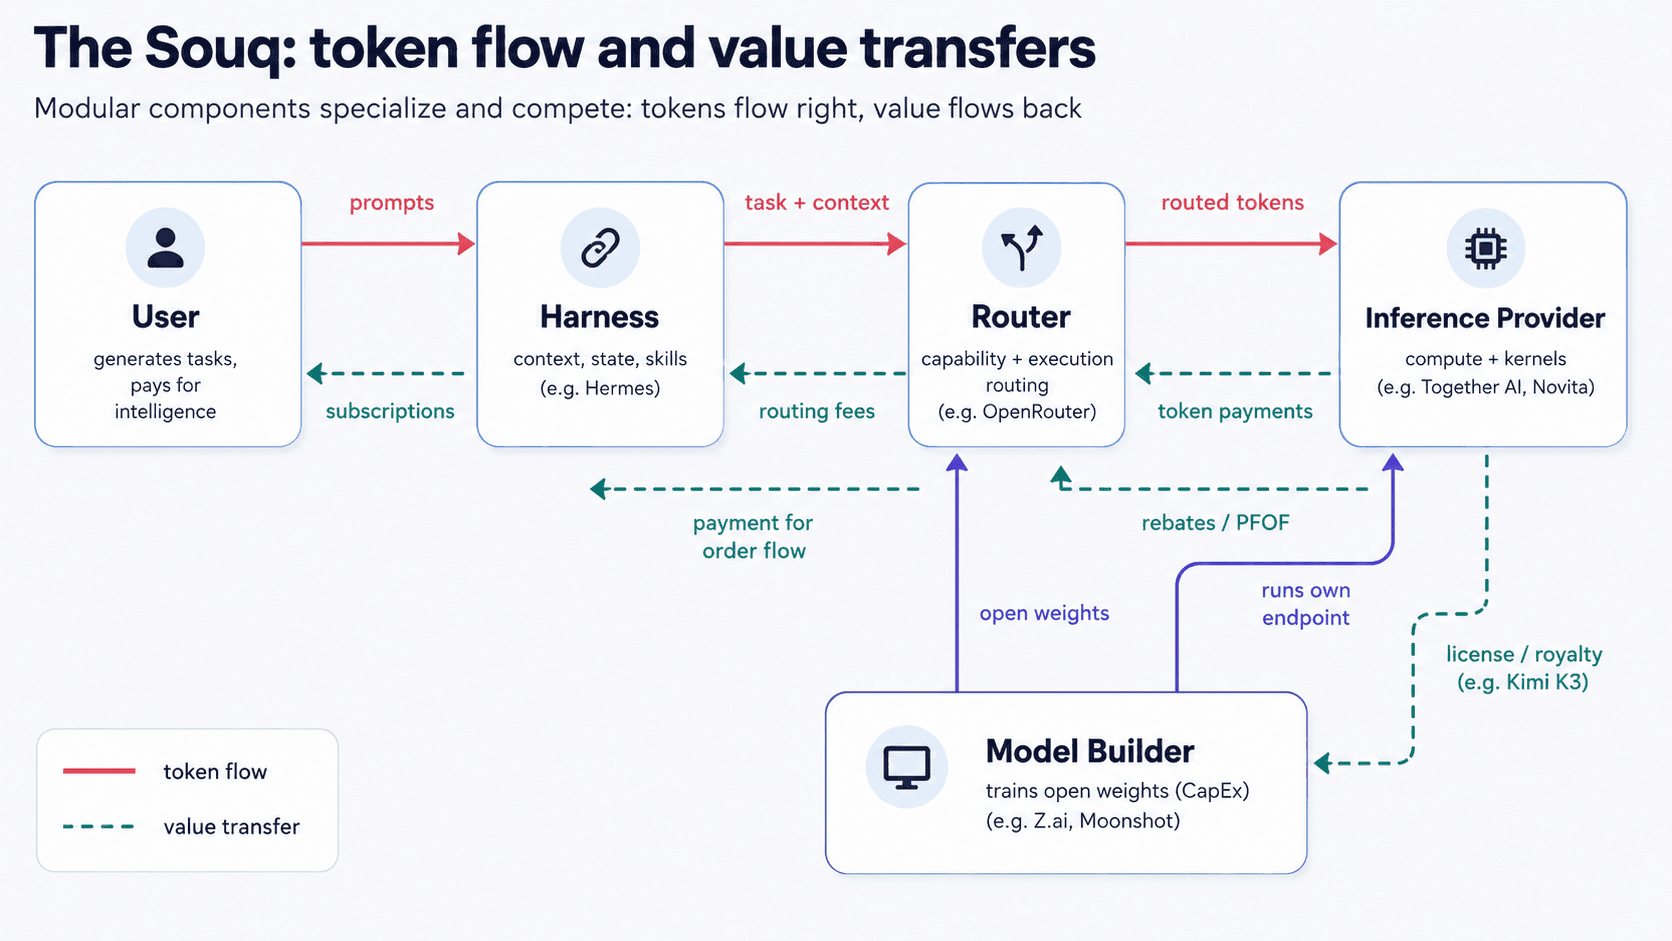
How tokens and value flow through the Souq’s modular components
Market Integrity
In virtually all multi-agent marketplaces, there is often a question of whether particular participants can unfairly extract value from other participants or harm consumers. For instance, spoofing on traditional equities exchanges[4] or Maximal Extractable Value on blockchains are viewed as a means to distort prices against consumers and other market participants. Similarly, online ad auctions have long suffered a quality problem, where an ad buyer receives lower quality placement than what they were promised by a platform.[5] This problem is also known to be found in open weights markets — e.g. an inference provider running a cheaper model or quantizing it.[6]
However, until the advent of routers such as OpenRouter, it was not clear how one could measure market integrity for open weight models. Routers help create an open and more transparent playing field with public data generated by harnesses and inference providers. This data can be used to measure and monitor the strategies employed by inference providers to aggregate tokens. Using this data, we can estimate if market participants are using strategies to manipulate a router that give them more token order flow despite having worse pricing or quality.
On OpenRouter, inference providers can provide real-time quotes for their cost per token for input for a specific open weight model. OpenRouter then uses this pricing data to allocate tokens from apps (such as harnesses) to inference providers. This creates naturally a competitive market between inference providers who are incentivized to lower their prices in order to get more tokens.
How does routing actually work?
In order to measure market integrity on a platform like OpenRouter, we first have to understand how the router allocates tokens to different providers.[7] While the term “model routing” has been used to mean many things in academic and business contexts, routers like OpenRouter, Ramp, and Databricks share the following stylized structure:[8]
An application or user specifies a particular workflow that they want to execute (initial prompt, context, tool calls)
A capability routing algorithm analyzes the type of task being requested, maps a task to a set of evaluations (“evals”) that are most similar to the task, and then ranks the different models for suitability for the task based on these evals, community spend data, etc.
An execution routing algorithm takes in a desired model and the prices quoted by inference providers and allocates the tokens to an inference provider.
In the case of centralized/non-competitive routers (like Ramp and Databricks), their execution routing is not a competitive bidding process. Databricks routes across fixed, administrator-configured traffic splits to model endpoints the customer already pays for directly, with automatic fallbacks when an endpoint errors or rate-limits; Ramp selects among providers dynamically, scoring each model on its live latency and failure rates against a deadline, and passes through each provider’s list price. In both cases, the SLA guarantee comes from the router rather than from a contest: endpoints that violate latency or uptime targets are simply routed around. The same pattern runs inside large companies: Uber, Grab, LinkedIn, Expedia, and Instacart each route their internal AI traffic through a single gateway of this kind, and Palantir sells one to its customers.[9] We’ll briefly describe how these two routing algorithms work, but note that as the algorithms themselves are not open source software, we are describing their functionality based on stated documentation versus precise implementation.
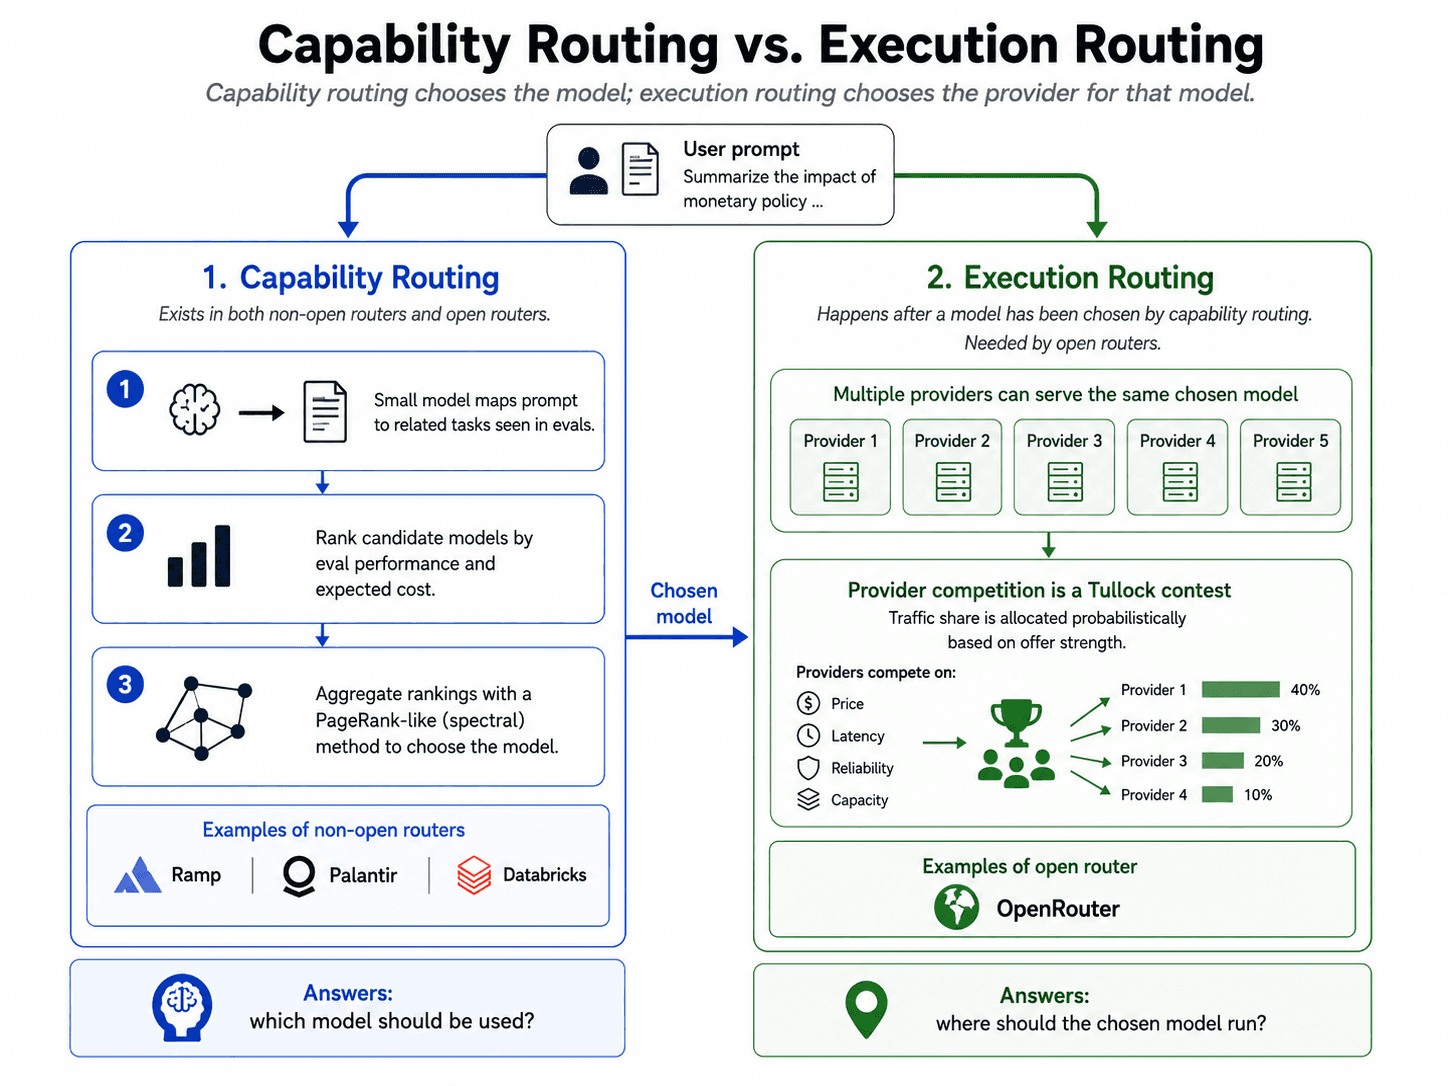
The two stages of routing: capability routing maps a task to a model by trading quality against cost; execution routing then assigns the request to one of the inference providers serving that model. The second stage is where the pricing game is played
Capability Routing
A capability routing algorithm’s goal is to maximize the expected quality of an output while minimizing the cost. Since the quality can’t be known ahead of time, one uses existing evaluations (“evals”) of the model on different tasks as a way of constructing a proxy estimate for expected quality. The algorithm constructs a quality score for each model that is used for the ranking. This quality score is constructed by statically analyzing the task at hand, mapping it to a set of evals for similar tasks, and then using the publicly posted performance of different models on that eval (e.g. on Arena.ai)[10] to construct the score. This eval-mapped construction is implemented almost literally by LMSYS’s RouteLLM; most commercial routers instead learn a quality predictor from preference or usage data. Next, the algorithm then computes the expected cost for each of these models for the task, based on the cost (in number of tokens) for the similar evals. Finally, the algorithm ranks the models based on an objective function that tries to maximize quality while minimizing cost. The simplest objective functions are either profit (e.g. quality score - cost) or margin (e.g. quality score / cost). However, in practice, the optimization is likely more complex, as anti-hallucination regularization terms may be added or constraints from the user might need to be respected. Such constraints include “no Chinese models allowed” or “only use models with no caching.”
Execution Routing
Execution routing takes place after capability routing selects a model for a task. The goal, given a selected model, is to assign the token generation to an inference provider who supports that model. Centralized routers, like Ramp or Databricks, allocate requests without any bidding: Databricks by statically configured traffic percentages, Ramp by a dynamic rule tuned on live latency and failures. On the other hand, the model that OpenRouter uses is a Tullock Contest — a contest where participants expend costly effort to try to win a resource. The classic Tullock contest has a participant’s probability of winning the resource proportional to the effort (e.g. cost) that they spend. However, numerous studies have shown that non-proportional Tullock contests can be more expensive to manipulate.[11] OpenRouter’s documentation first filters out providers with recent outages and then defines the probability of winning as a function of the quoted prices alone; latency and throughput enter only if the user explicitly sorts on them — which turns the contest off entirely. We formalize this later in the post.
OpenRouter’s Dark Forest
Given the high level market structure, we are ready to look at the real behavior of these actors in the largest public routing environment, OpenRouter. We first describe the data captured from OpenRouter to analyze strategic behavior amongst inference providers, leaving the full methodological details to the appendix. This will allow us to analyze the precise Tullock contest used and what the optimal strategic behavior looks like in this market. We then look at high level statistical trends, especially in the near-frontier markets of Z.ai’s GLM-5.2 and Moonshot’s Kimi-K3. We identify four archetypes of inference providers in these markets — suggesting there are some strategic and potentially manipulative behaviors at play.
Provider Pricing
Each provider on OpenRouter quotes three prices on the marketplace:[12]
Input Token Price, \(p_i^I\): Price per million tokens of input tokens (e.g. user prompt, other context/metadata)
Output Token Price, \(p_i^O\): Price per million tokens of output tokens (e.g. number of tokens in the response from the model)
Cached (read-only) Token Price, \(p_i^C\): Price per million tokens of cached tokens
The first two prices are relatively self-explanatory and give providers the ability to discriminate on pricing based on their expected cost for running different models on the hardware they have. The latter price, which is included by default in the OpenAI API, allows providers to offer a cheaper price for tokens that are repeated and resident in a KV-cache. This can lead to large cost savings in agentic workflows, where cached tokens are common, as prefixes of the prompt and/or task are often repeated in subsequent prompts made by the agent.
Cached Token Price is not Verifiable. One of the main reasons the service that OpenRouter offers is possible is because open weight models have standardized using OpenAI-compatible APIs. However, the components of the output of the API are not tamper-resistant as a user cannot independently verify the output of an API request. According to both the OpenAI and OpenRouter API documentations, the API operator provides both the OpenAI-compatible API response usage.prompt_tokens_details.cached_tokens and the OpenRouter API response for cached_tokens. In particular, this means that an inference provider can maliciously send a malformed OpenAI-API compatible response that claims there was no caching even if there was.
The Four Horsemen of Inference Provision. There are a number of different types of inference providers on OpenRouter. Virtually all model builders (e.g. the entity that trained the model, such as Z.ai or Minimax) run their own inference provider. The inference provider business is the main source of revenue for these companies and inference funds the training of future models. We bucket all other inference providers who participate on OpenRouter into four categories and provide examples from GLM-5.2 market:
Well-Funded Copy Pricers: These are inference providers whose compute is mainly used to service non-public, enterprise contracts, but participate in OpenRouter for marketing and/or to exist on the leaderboard. These entities range from venture funded (Together AI, Modal, Baseten, Fireworks, Venice, Crusoe) to public companies (Cloudflare, DigitalOcean). These entities seem to have the least amount of strategic pricing, precisely copying the price posted by the model builder (see below).
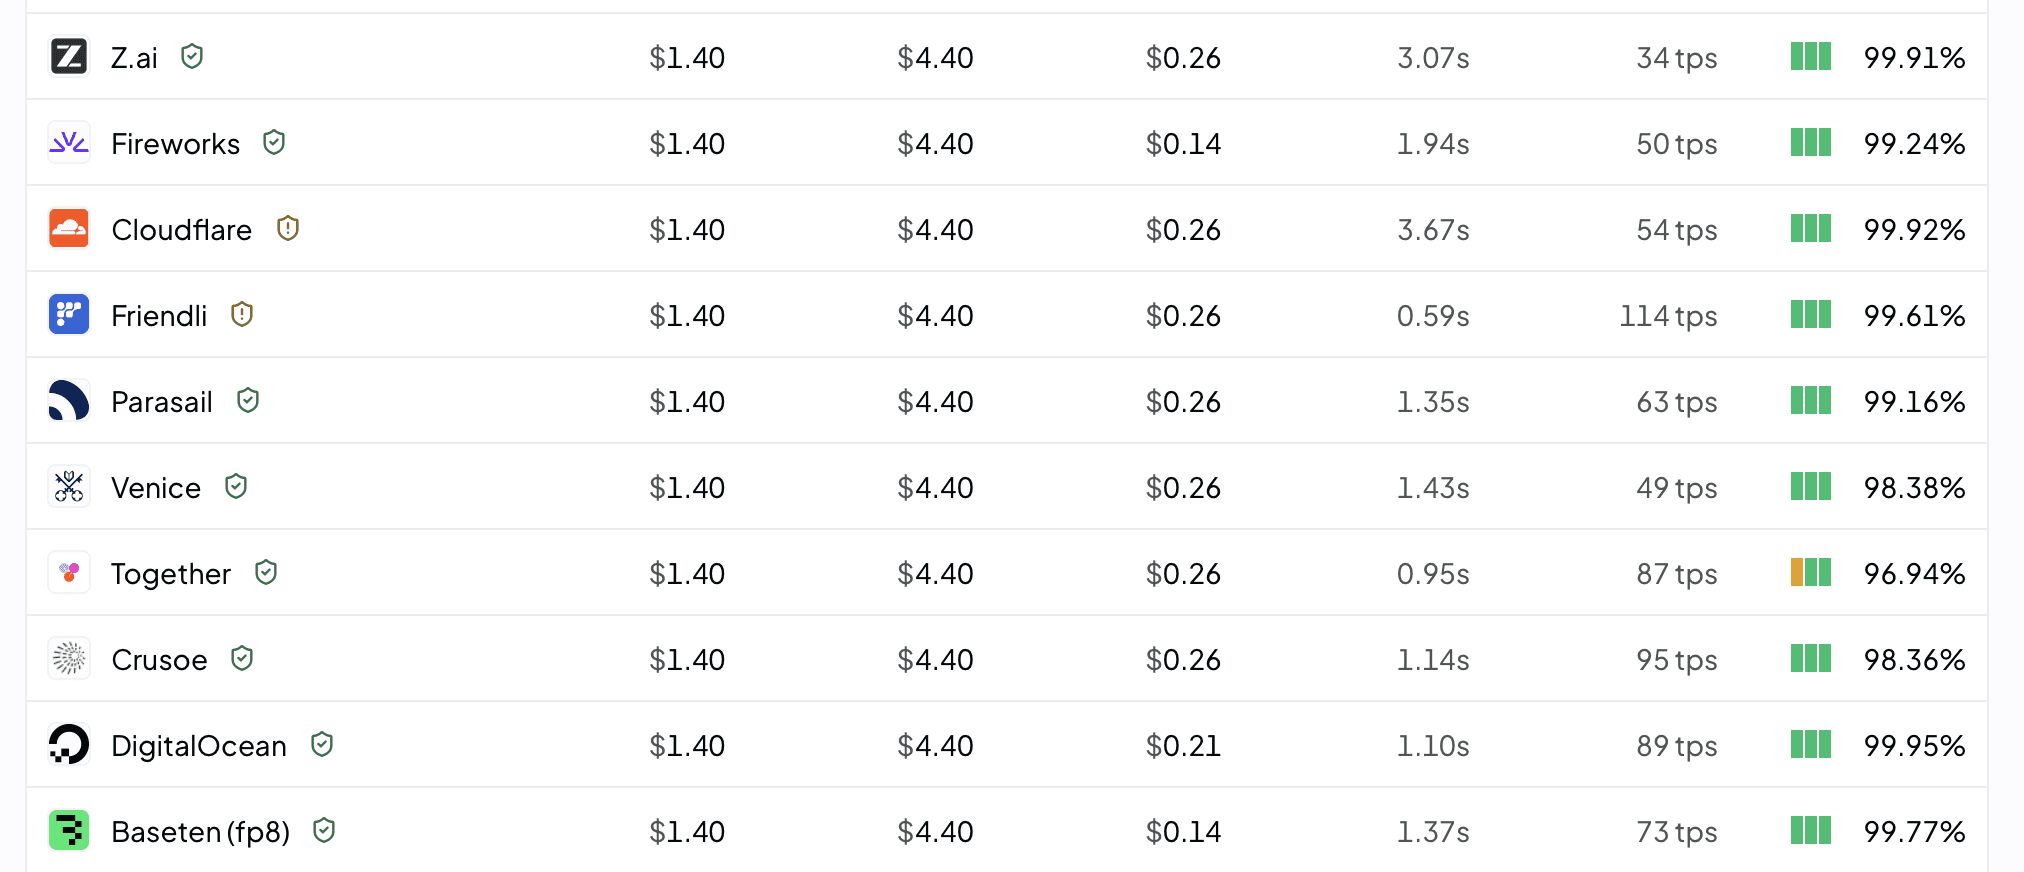
Well-funded copy pricers: venture-backed and public-company providers quoting exactly the model builder’s price — on the leaderboard for distribution, not competing on price
Specialist Providers: Inference providers who either use custom hardware (e.g. Cerebras) or improve kernel performance to offer faster inference. Usually, these are “fast” modes provided by the same well-funded providers; however, some, such as Wafer, are nascent and building a competitive edge via optimized provisioning. The pricing of these providers will be higher than that of the model builder.
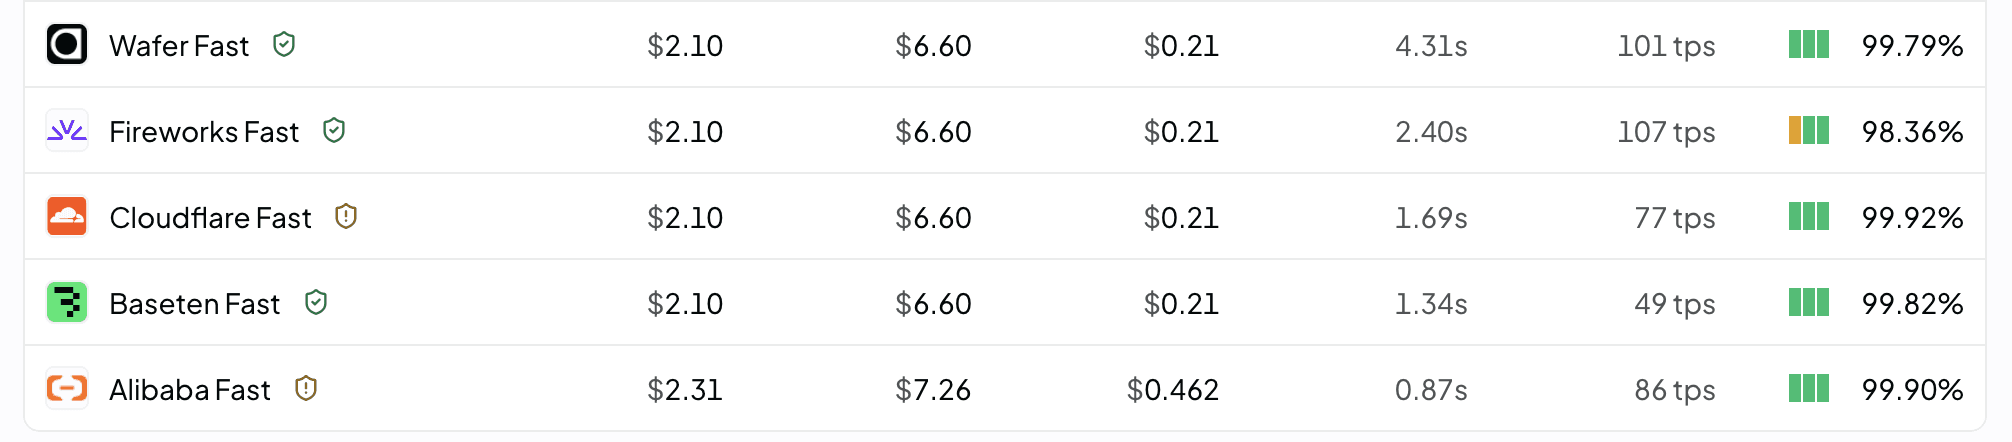
Specialist providers: custom hardware and optimized kernels sold at a premium to the model builder’s price — faster tokens, not cheaper ones
Rebaters: These are providers who provide static prices below the model builder. They don’t dynamically adjust their prices but rather, effectively provide a rebate by pricing below what the model builder quotes.
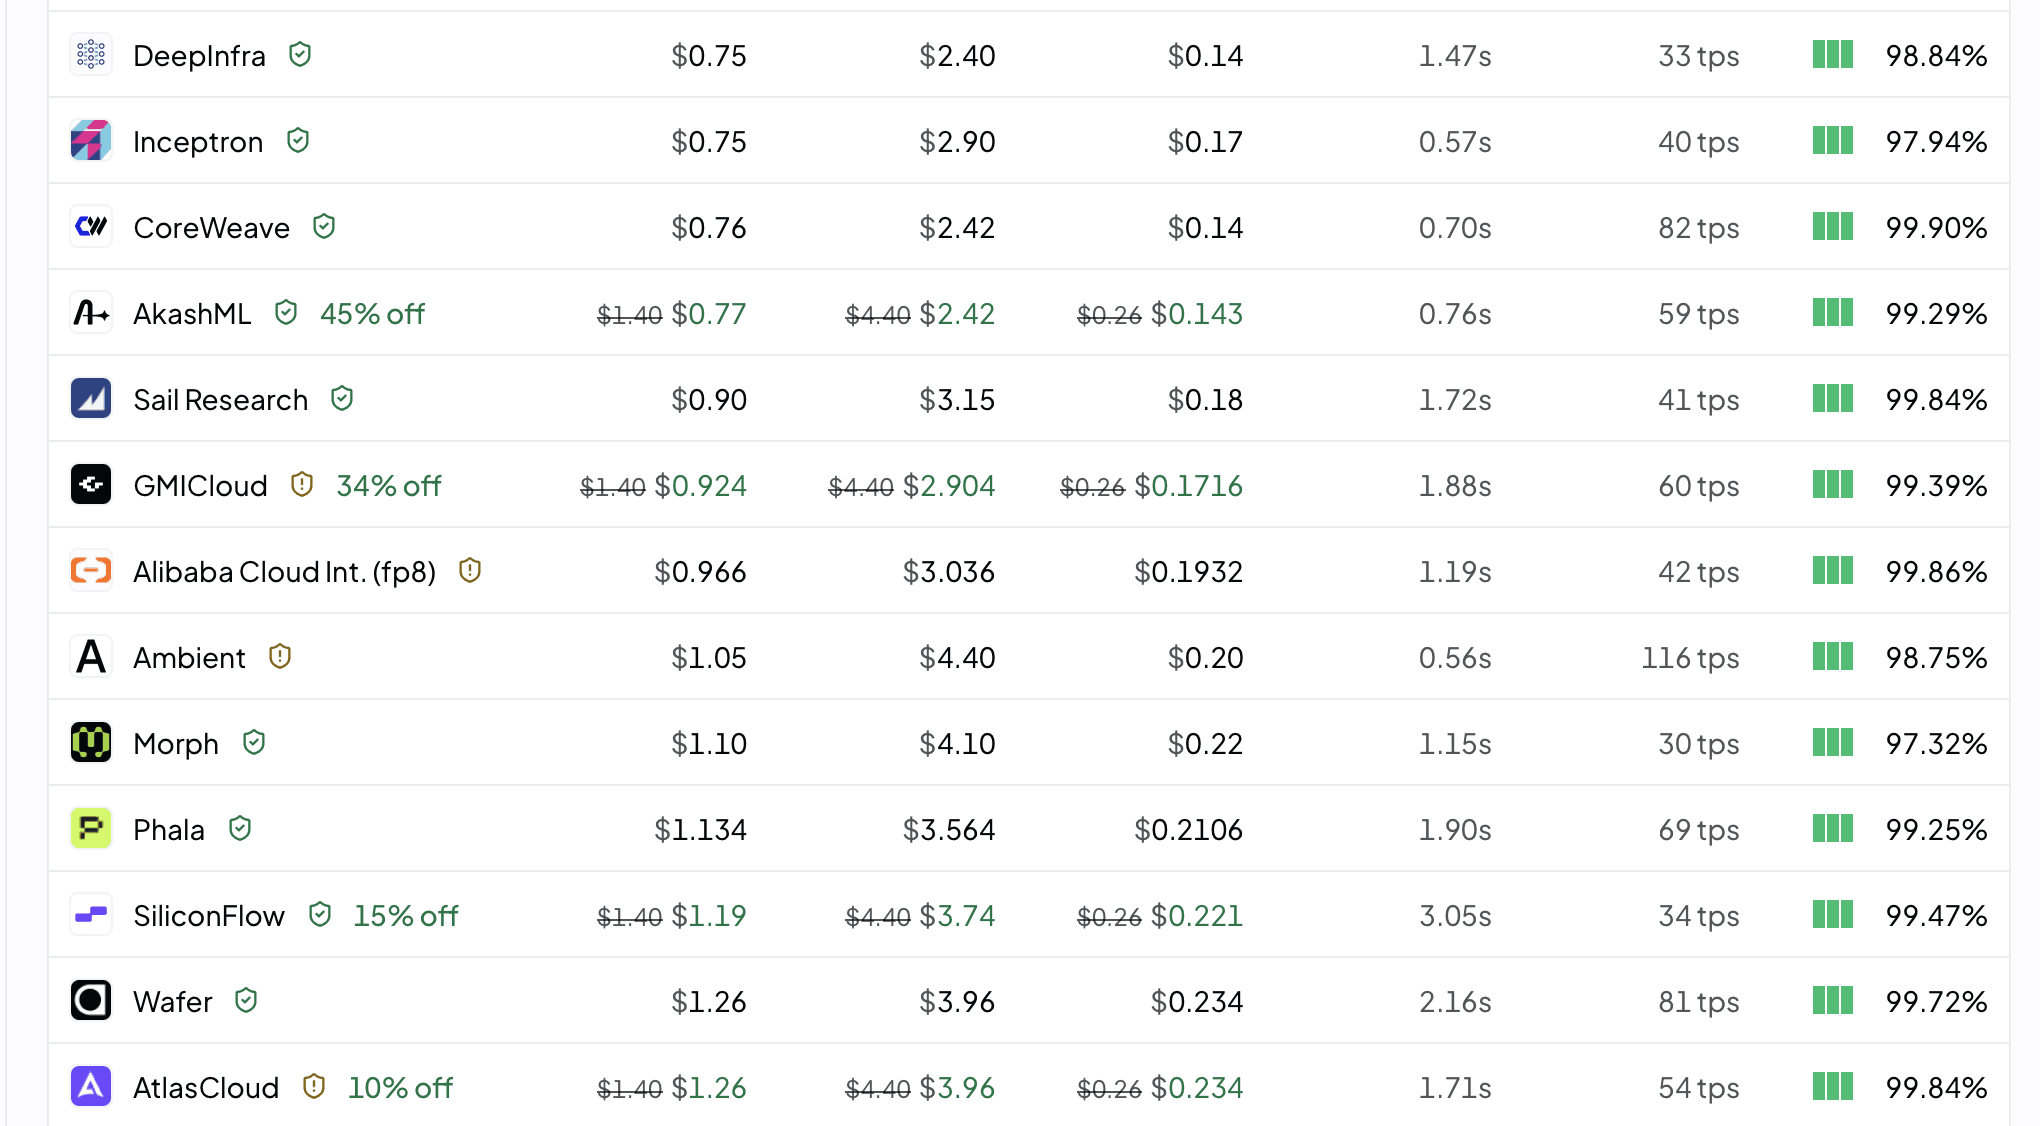
Rebaters: static quotes pinned below the model builder — a standing discount, not a strategy that responds to the market
Repricers: These inference providers are frequently updating their pricing and dramatically undercutting the model builder. In this screenshot, you can see that StreamLake (which is a datacenter business owned by Chinese social media application Kuaishou) and Novita are pricing at 5-10% of the price that the model builder is offering.

Repricers: StreamLake and Novita quoting 5–10% of the model builder’s price and updating constantly — the only archetype that plays the contest dynamically
Competitive Equilibria
OpenRouter’s marketplace involves applications — entities that generate tokens, such as harnesses or specialized applications like Framer — and inference providers who provide compute. Applications send their context (prompts and auxiliary data) to OpenRouter’s API, which selects a model via capability routing for the user. Then the router uses a Tullock contest to allocate these input tokens to a particular inference provider.
Tullock Contests. Tullock Contests provide a theoretical framework for analyzing how a fixed rent — such as a payment for tokens — is distributed amongst a set of competing providers. They are used to describe everything from government procurement auctions to advertising and military war games.[13] Tullock contests have \(n\) participants who each contribute an “effort” \(x_i\) in order to realize a reward \(R\). Effort represents the relative quantity of resource that a provider expends to try to realize the reward versus another. The contest is fully specified by its allocation rule\(A\), which maps the efforts \(x_i\) to a set of probabilities \(\pi_i\) such that the expected reward of provider \(i\) is \(\pi_i R\).
The first contest studied in Tullock’s Efficient Rent Seeking (1980) is the allocation rule
\[\pi_i = A(x_1, \ldots, x_n)_i = \frac{x_i^r}{\sum_{j=1}^{n} x_j^r}\]
The exponent \(r\) represents decisiveness — a higher value of \(r\) implies that smaller relative changes in effort will cause larger disparities in expected reward. It can also be viewed as controlling the log odds for participants. For instance, if \(r = 2\), if participant \(i\) puts in two times more effort than participant \(j\), then \(i\) increases their probability of winning relative to that of j by four times. Put another way, when \(r > 1\), the impact in terms of expected reward of increasing effort is super-linear in effort.
OpenRouter is a multi-dimensional Tullock Contest. OpenRouter’s documentation[14] states that the allocation rule does the following:
Each of \(m\) providers posts a pricing vector \((p_i^I, p_i^O, p_i^C)\), where \(p_i^I\) is the price per million input tokens, \(p_i^O\) the price per million output tokens, and \(p_i^C\) the price per million cached tokens
First filters the set of \(m\) participants to the maximum subset of size \(n\) that have high quality score (where the quality score is not published but relies on a provider’s latency, uptime, and historical TPS performance)
OpenRouter computes a composite price \(P_i = P_i(p_i^I, p_i^O, p_i^C)\) and then allocates to provider \(i\) with probability \(\pi_i \propto 1/P_i^2\)
If we define the effort \(x_i = 1/P_i\) then, since \(\pi_i \propto 1/P_i^2 = x_i^2\), this can be viewed as a standard Tullock allocation rule with decisiveness 2. Higher decisiveness means that smaller increases in effort by a single participant can super-linearly increase their expected allocation and reward. In particular, this means that it is possible for an inference provider to make a small price decrease (which would increase their effort) to gain a much higher reward than their price increase saves in returns to the end user. The same super-linearity has a cruder cousin: because the rule scores each listed endpoint on its own, a decisiveness above one is not Sybil-resistant — an owner can split into economically identical duplicate endpoints and raise its combined share without touching its price.[15] We note, furthermore, that the function \(P_i\) that maps the user quoted prices to a scalar composite price is not explicitly defined in the OpenRouter documentation and we measure it from the router’s observed choices.[16] In short, \(P_i \sim p_i^I\).
While the documentation is underspecified, we can measure which price the router actually uses. OpenRouter lets a user ask for the cheapest provider directly, and when asked, the router has to reveal who it thinks is cheapest. We sent thousands of these requests. The informative moments are when one provider quotes the lowest input price while a different provider quotes the lowest output price — the router then has to pick a side. In every case we observed — 64 of 64 such choices across two markets — it picked the provider with the cheapest input tokens. If output price carried more than a few cents of weight per dollar of input price, the router would have made different choices. The cached-token quote has no effect we can detect: adding it to a model of the router’s choices improves prediction by exactly nothing (see plot below). For ranking providers, the contest price is effectively the input token price. Our exact fitting methodology is described in the methodology appendix.
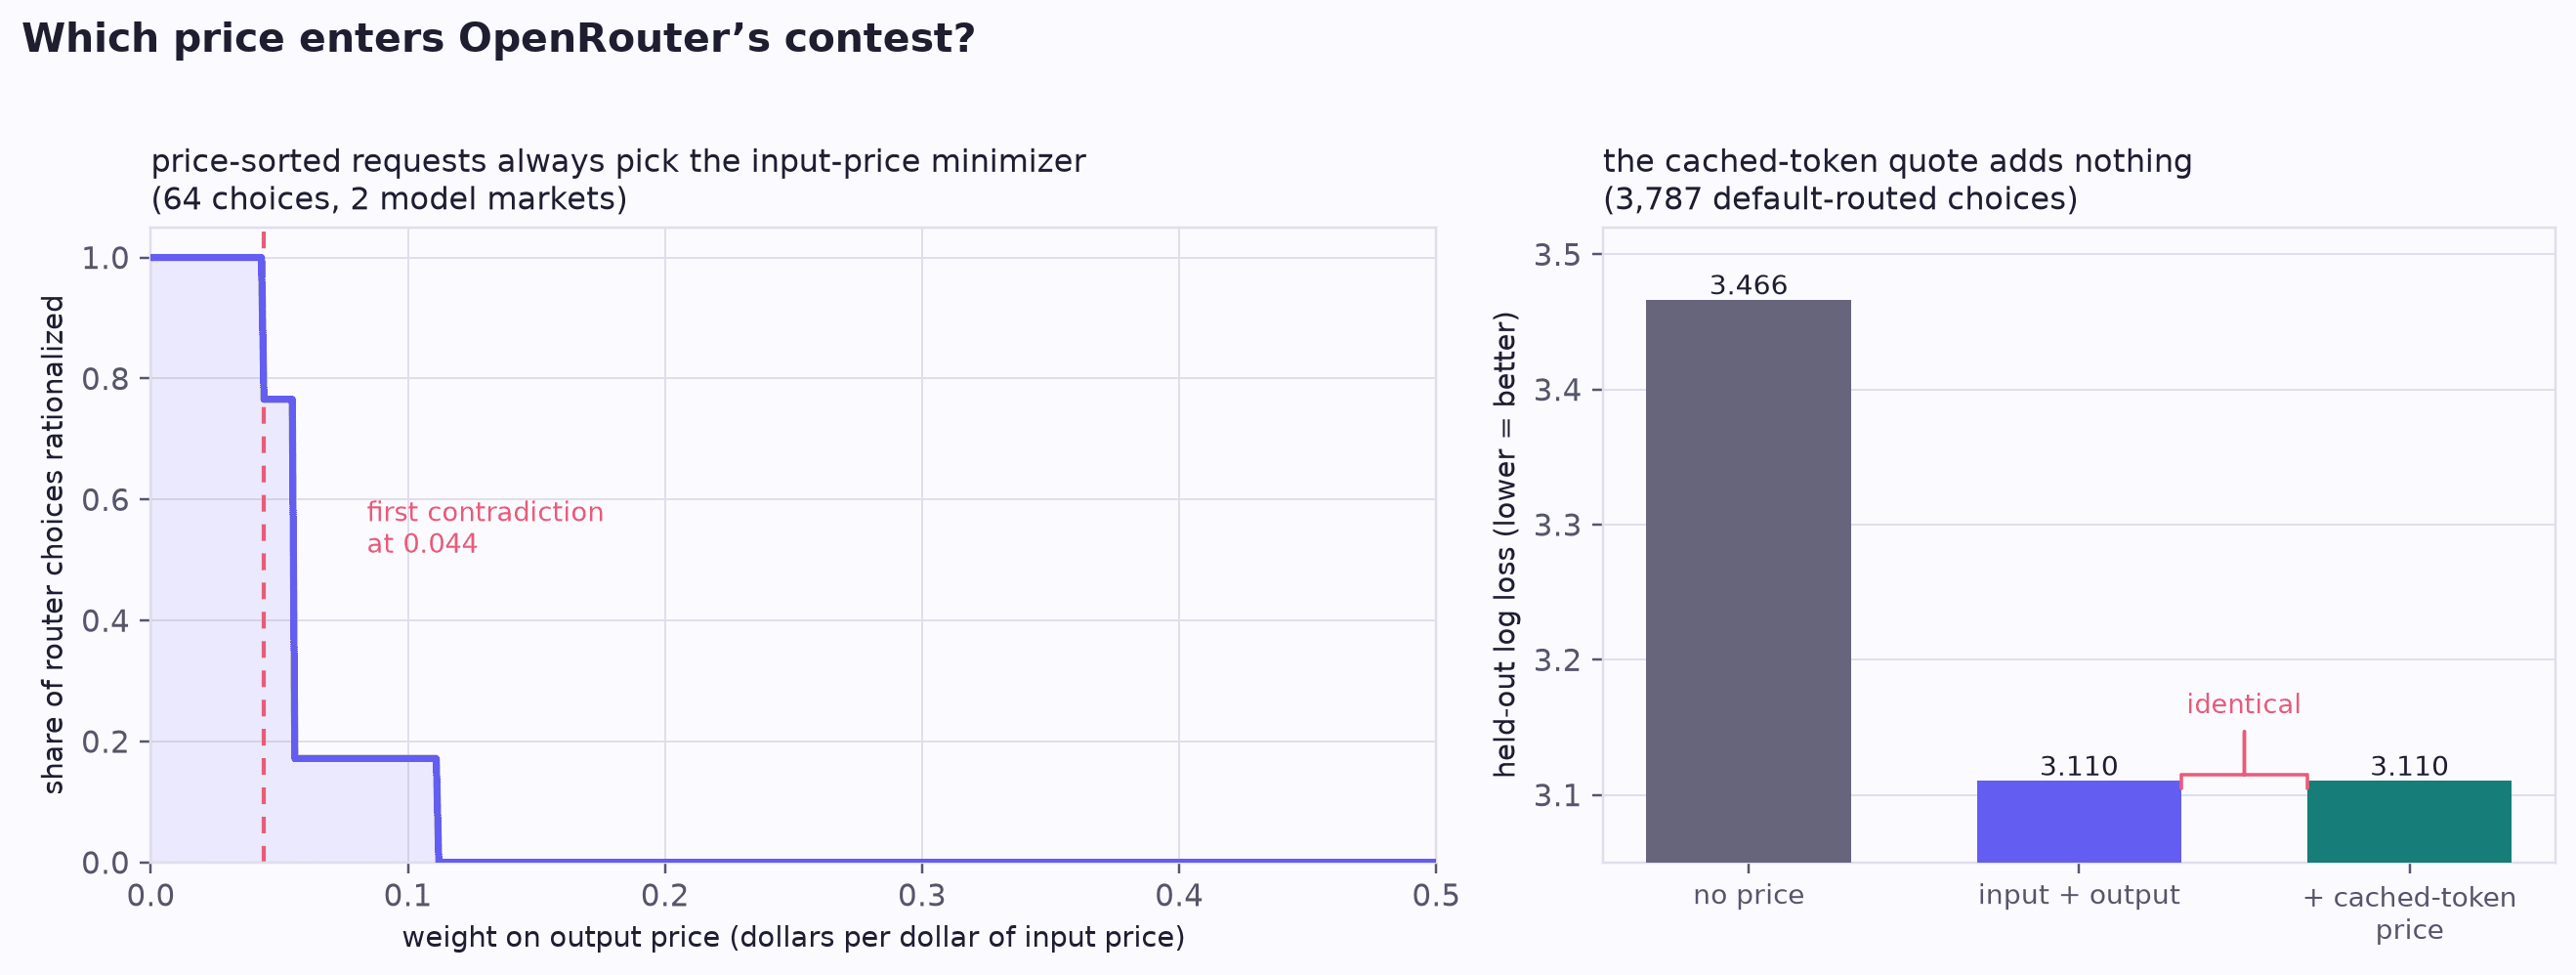
Which price enters the contest? Left: every cheapest-provider pick the router revealed is explained by input price alone — give output price more than a few cents of weight per dollar of input price and the picks stop making sense. Right: adding the cached-token quote to a model of the router’s choices improves prediction by exactly nothing. The router ranks on input price and ignores the price where the money moves on repeated context
Cache me if you can
One strategy that an inference provider can use to increase their revenue while reducing consumer welfare is to charge for cached tokens as if they were uncached. However, if this negatively influences the router’s probability of allocating to such a provider in the future, then they might lose long-term revenue. A natural question to ask is if OpenRouter’s Tullock Contest, which has a partially public scoring rule, allows for an execution of such a strategy without reducing long-term revenue. This is analogous, in many ways, to Maximal Extractable Value in blockchains, where strategic users are able to extract a profit from less sophisticated users by strategically updating pricing. A stylized version of such a strategy is:
A provider reduces their quoted price on input and output tokens dramatically below other providers
This increases their market share super-linearly, so their volume of tokens received from the router goes up relative to competing providers
They then report, by manipulating responses to the cached token API, that they didn’t use any cached tokens in order to charge the higher rate
Indirectly, one can think of the strategic provider as manipulating the caching mechanism to provide a form of stateful “memory” to the router, where if a provider is chosen at time t, they are more likely to be chosen at time t+1 despite charging the user a higher price.[17]
Example. As a simple example of how this is profitable relative to honest token reporting behavior, suppose that an honest / non-strategic provider offers $1 per million input and/or output tokens and $0.01 per million cached tokens, while a strategic provider offers $0.6 per million input and/or output tokens and $0.02 per million cached tokens. For a million token workload with half of the tokens cached, the honest provider charges $1/million tokens * 0.5 * 1 million tokens + $0.01/million tokens * 0.5 * 1 million tokens = $0.505 whereas the strategic provider charges $0.6/million tokens * 1 million tokens = $0.6. Despite charging less to increase their volume, they increase their profit relative to the honest provider (who gets less token volume).
Is there evidence that inference providers are executing this type of strategy in live OpenRouter data? Yes!
Results. We designed a sequence of experiments that we ran on OpenRouter where we repeatedly asked a sequence of prompts with varying levels of caching. Repeated prompts and/or shared context often occur in agentic workflows, so this setup is relatively realistic. We provide the full details of the experiments in the methodology section below. We looked, in particular, at how caching changed before and after an inference provider changed their price. From these experiments we find three results:
Repricers (especially Novita) appear to have significantly fewer cache hits than the model provider upon repricing / adjusting their quote
The lack of cache hits leads to decreased user welfare — the more a workflow uses repeated context, the more a user pays a repricer. We find cases where even though the repricer charges 50% less than the model builder, the user can end up paying more to use the “lower price” repricer than using the model builder
In the worst case, we find that on average it only takes a roughly 5 repeated queries for the loss that users face from a repricer to be worse than simply using the model builder’s API endpoint
Repricers have worse cache performance.
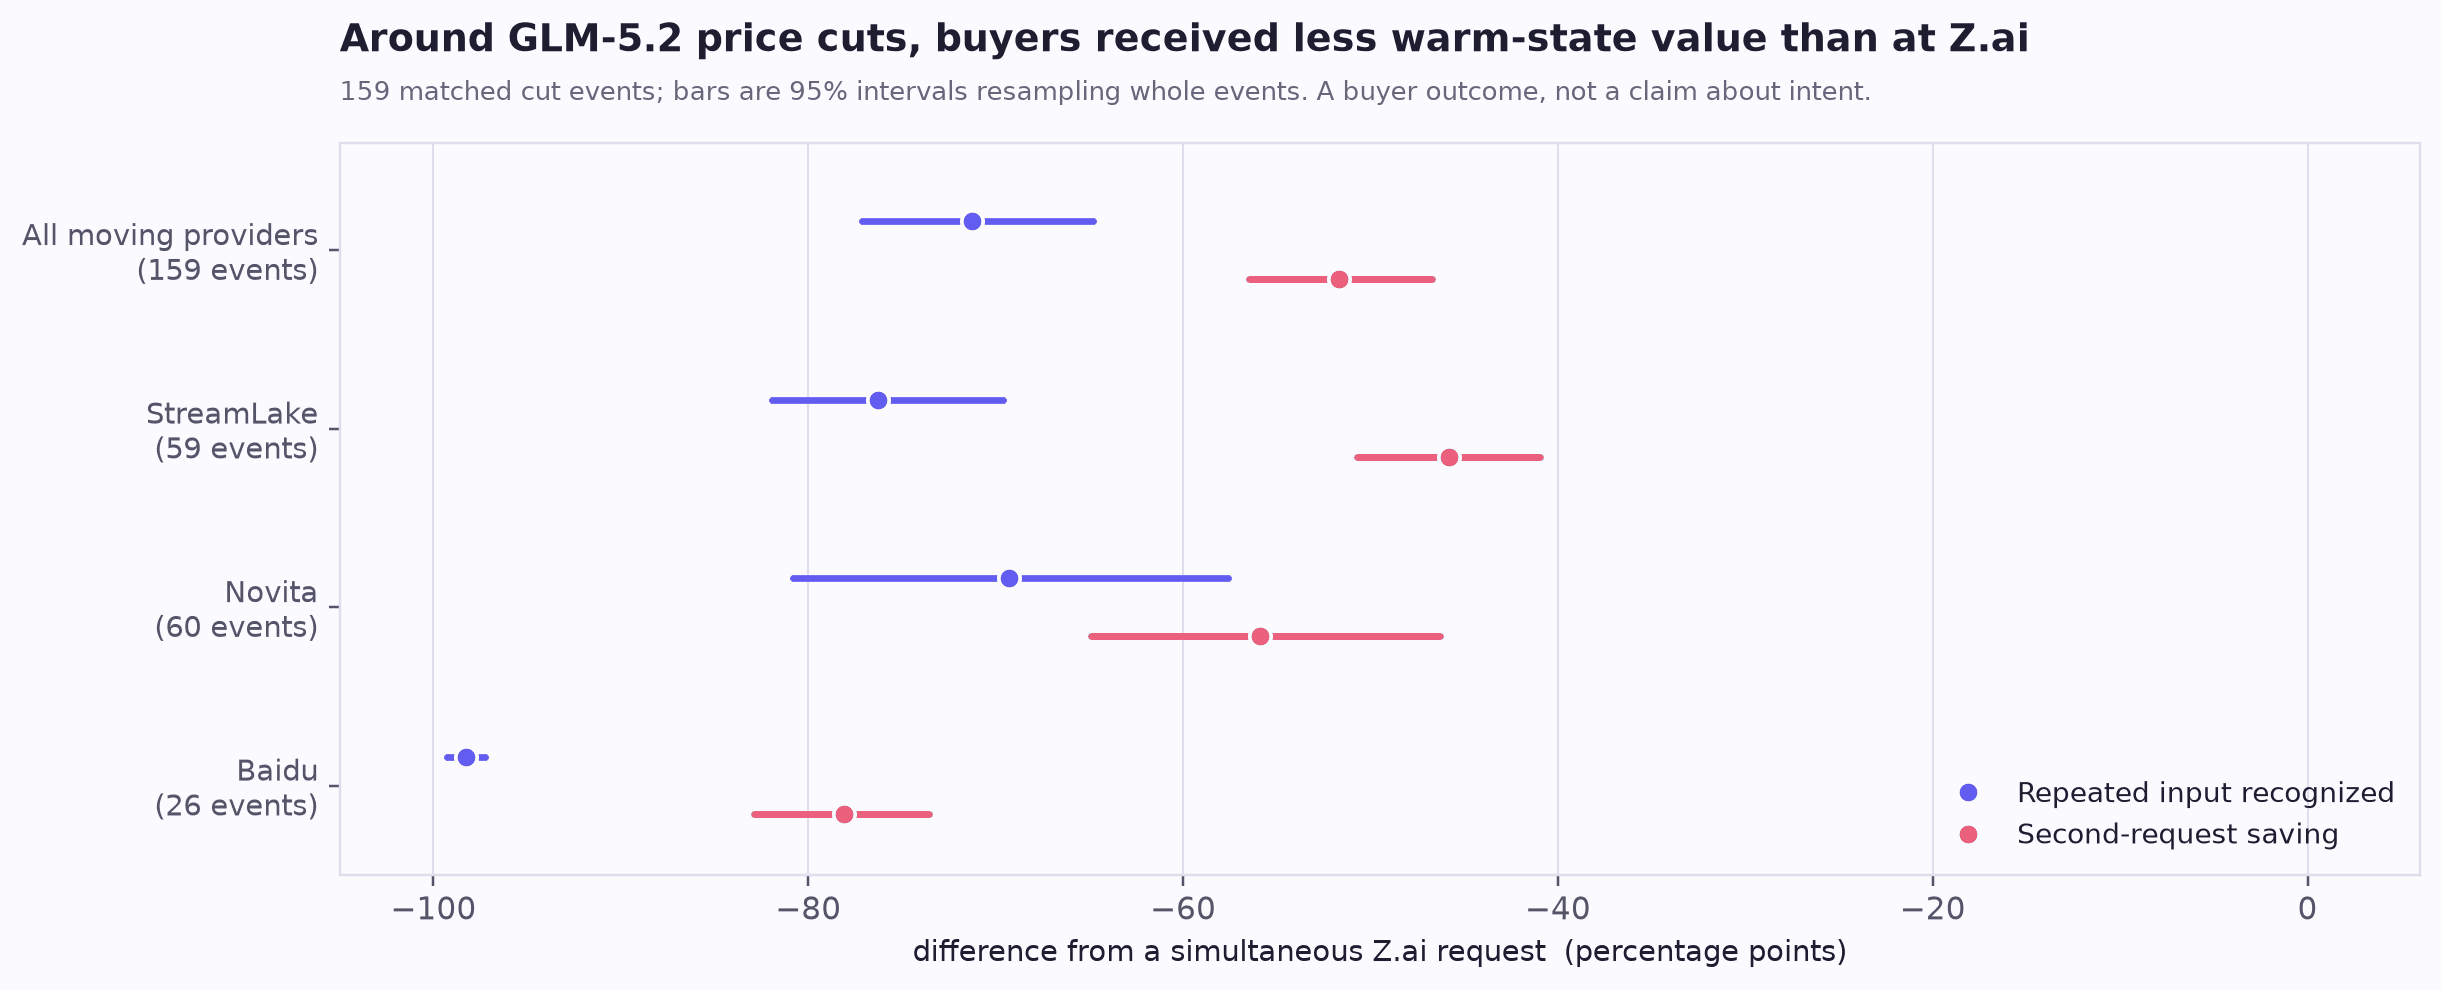
Right after a provider cuts its price, we send the same repeated prompt to it and to Z.ai at once. The cutting providers treat 71 percentage points less of the repeated text as cached, and pass on 52 points less of the savings a warm cache would give — so the identical follow-up query costs the user far more than it would at Z.ai. This measures how much more users pay on a repeated query, not why: the provider could be gaming the price, or simply incompetent (e.g.* restarting its machine, and wiping its cache, on every price update).*
We see different cache profiles for GLM-5.2. The model builder, Z.ai, is used as a benchmark and we compare how much of the response was cached (e.g. measuring cached token vs. output tokens) and the difference in cost. The three most aggressive repricing providers, StreamLake (a unit of Chinese social media application Kuaishou), Novita, and Baidu, have both significantly worse cache performance and higher prices on repeated queries.
Lack of caching means users pay more.
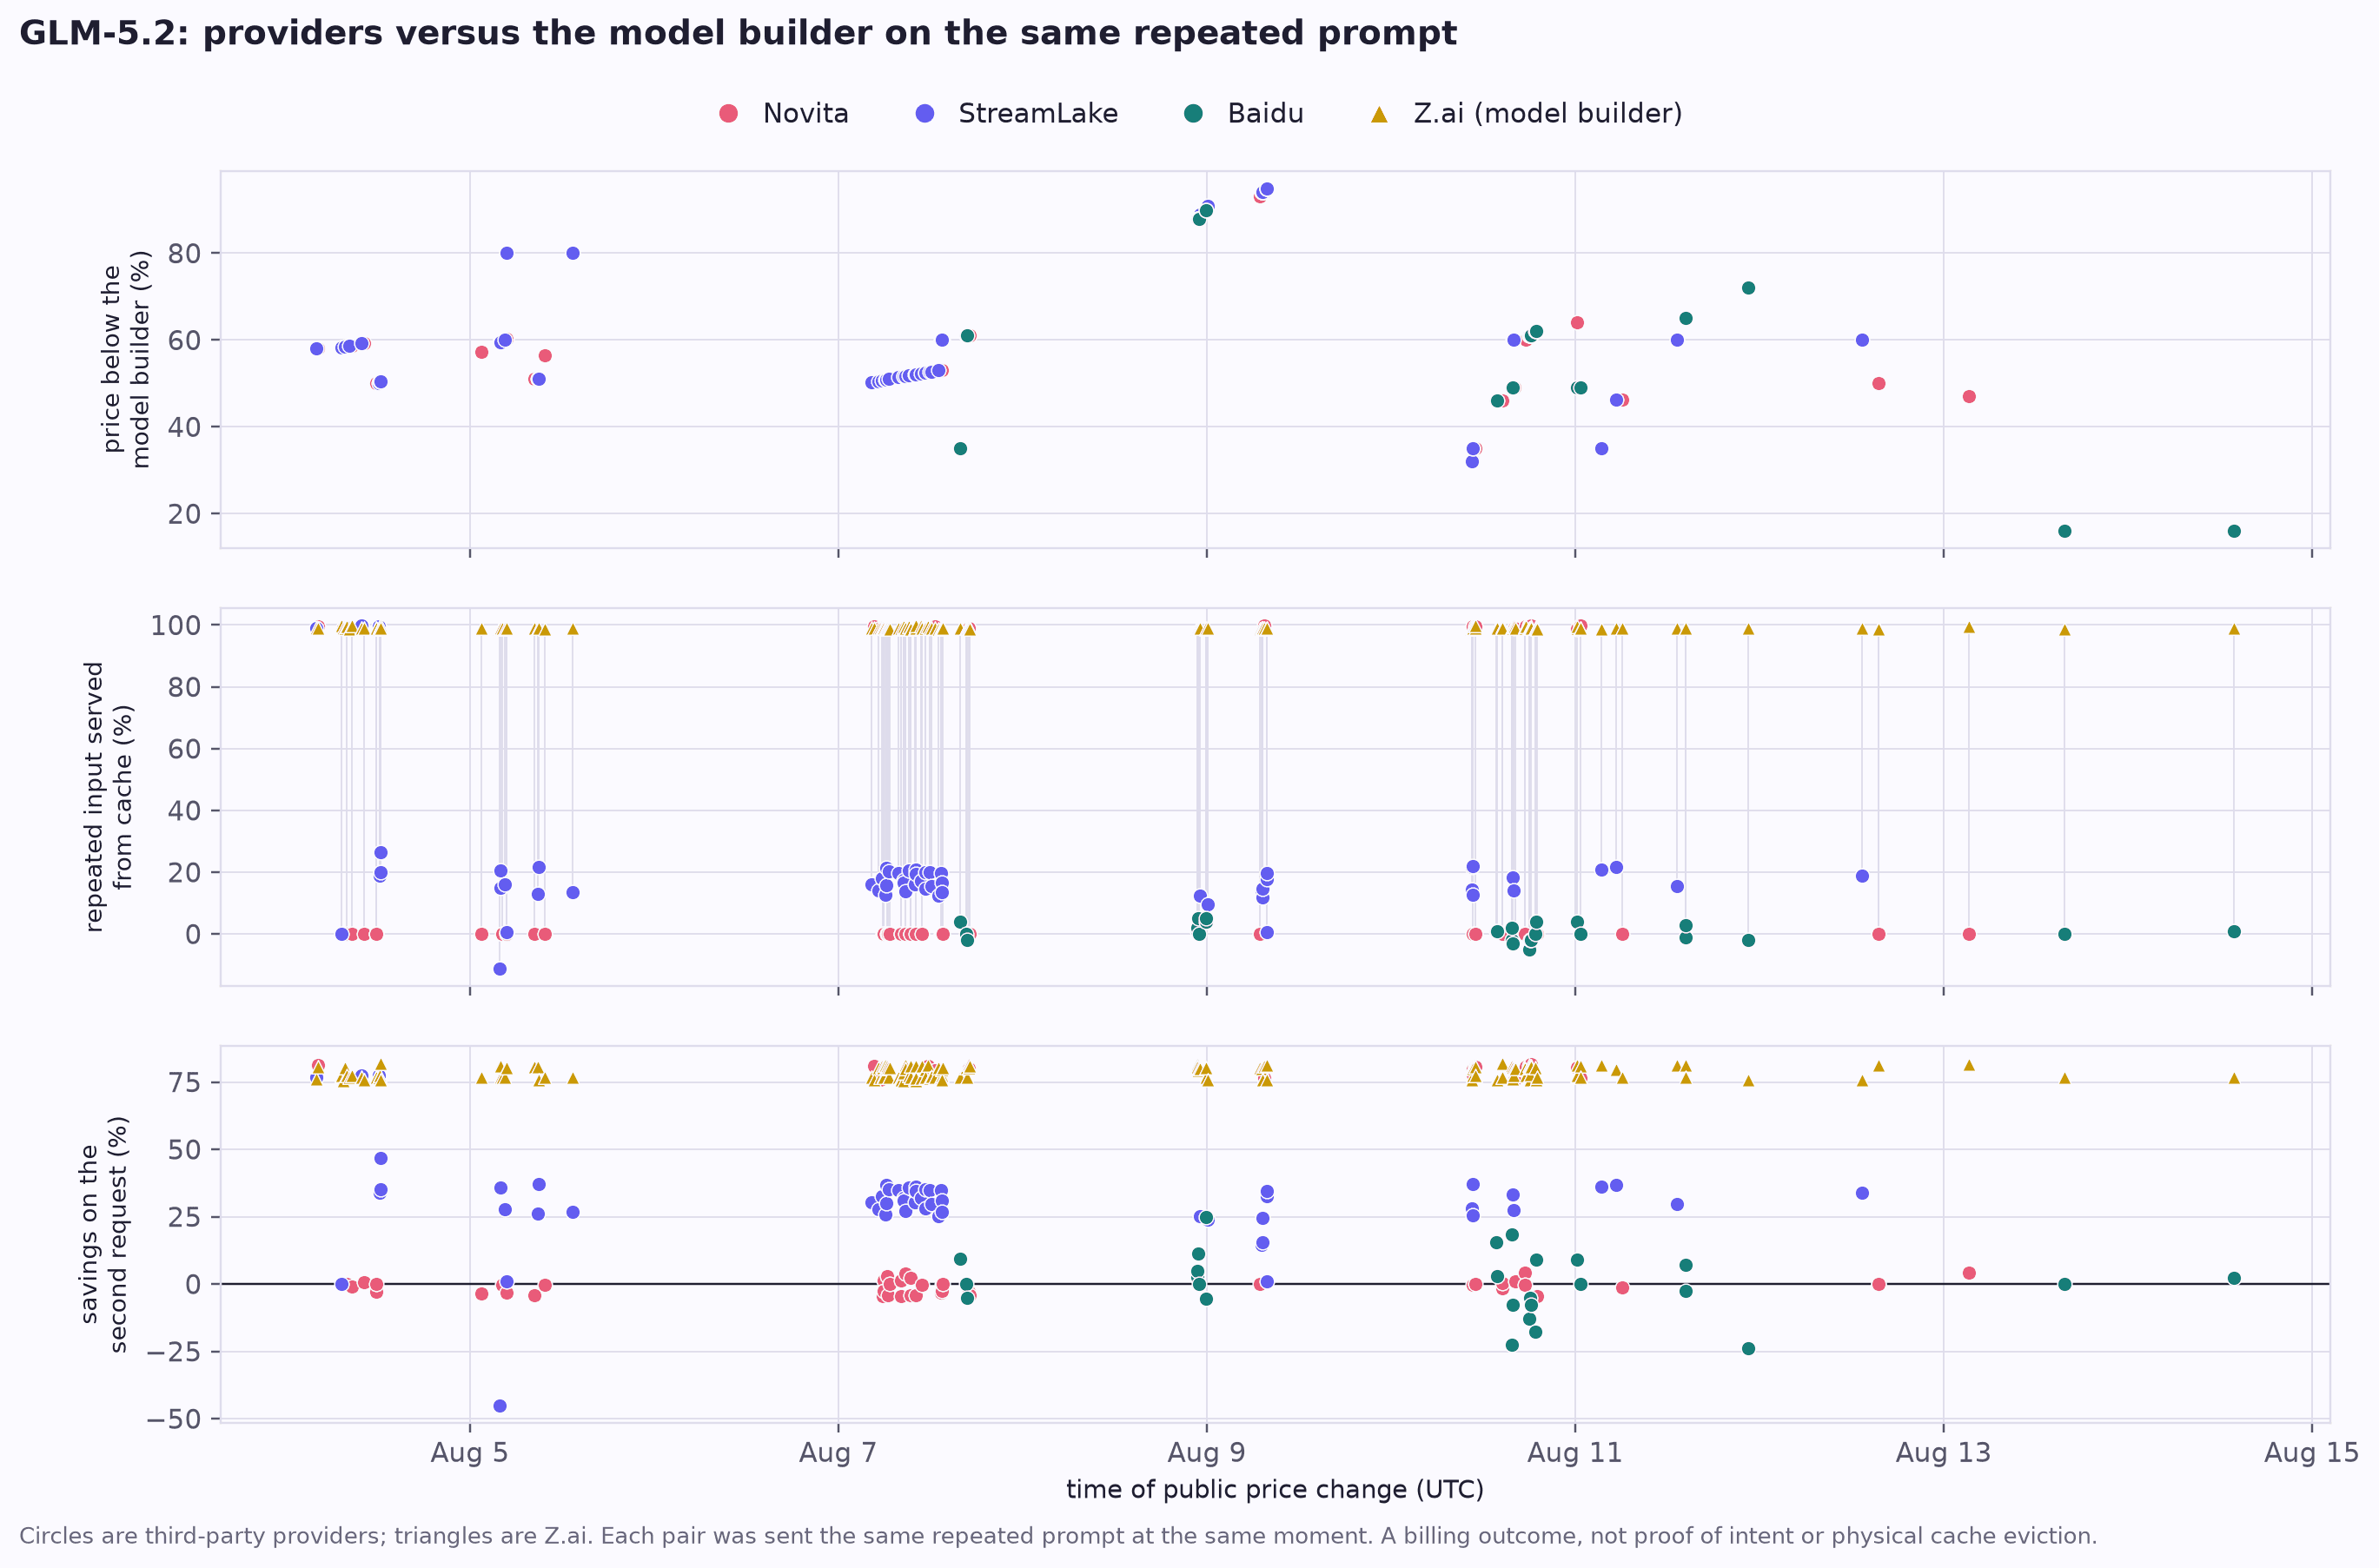
What happens around a price cut: the top panel shows the repricer’s cut relative to the model builder; the middle panel shows cache recognition collapsing at the cut — some providers report even fewer cached tokens on the second identical prompt, consistent with a full eviction; the bottom panel shows the user’s savings on repeated prompts decaying after the cut
Next, we look at how the caching behavior of repricing inference providers changes over time. In the top panel, we can see the price cut (for input tokens) that repricers make relative to the model builder. We look at how cache performance changes when there is a repricing event. The second panel shows how much of the input was cached at the time of a price cut. Curiously, some providers reported even fewer cached tokens on the second repeated prompt — suggesting a full cache eviction took place after the price cut. This leads, as the third panel shows, to a sharp decay in user savings on repeated prompts.
Are they doing it on purpose? We can’t subpoena anyone’s cache policy, and our experiments cannot distinguish a provider that evicts state strategically from one that rebuilds its serving stack every time it touches its price. But the distinction barely matters economically. The pattern — cut the visible price, drop the cache, bill repeated tokens at the full rate — is exactly what a strategic provider would choose, it recurs at hundreds of repricing events (Novita alone repriced roughly five hundred times in July), and the provider keeps the proceeds either way. A pricing model that advertises a discount the buyer predictably does not receive is misleading in effect, whatever its intent.[18]
Users can pay easily more than if they simply just used the model builder’s endpoint.
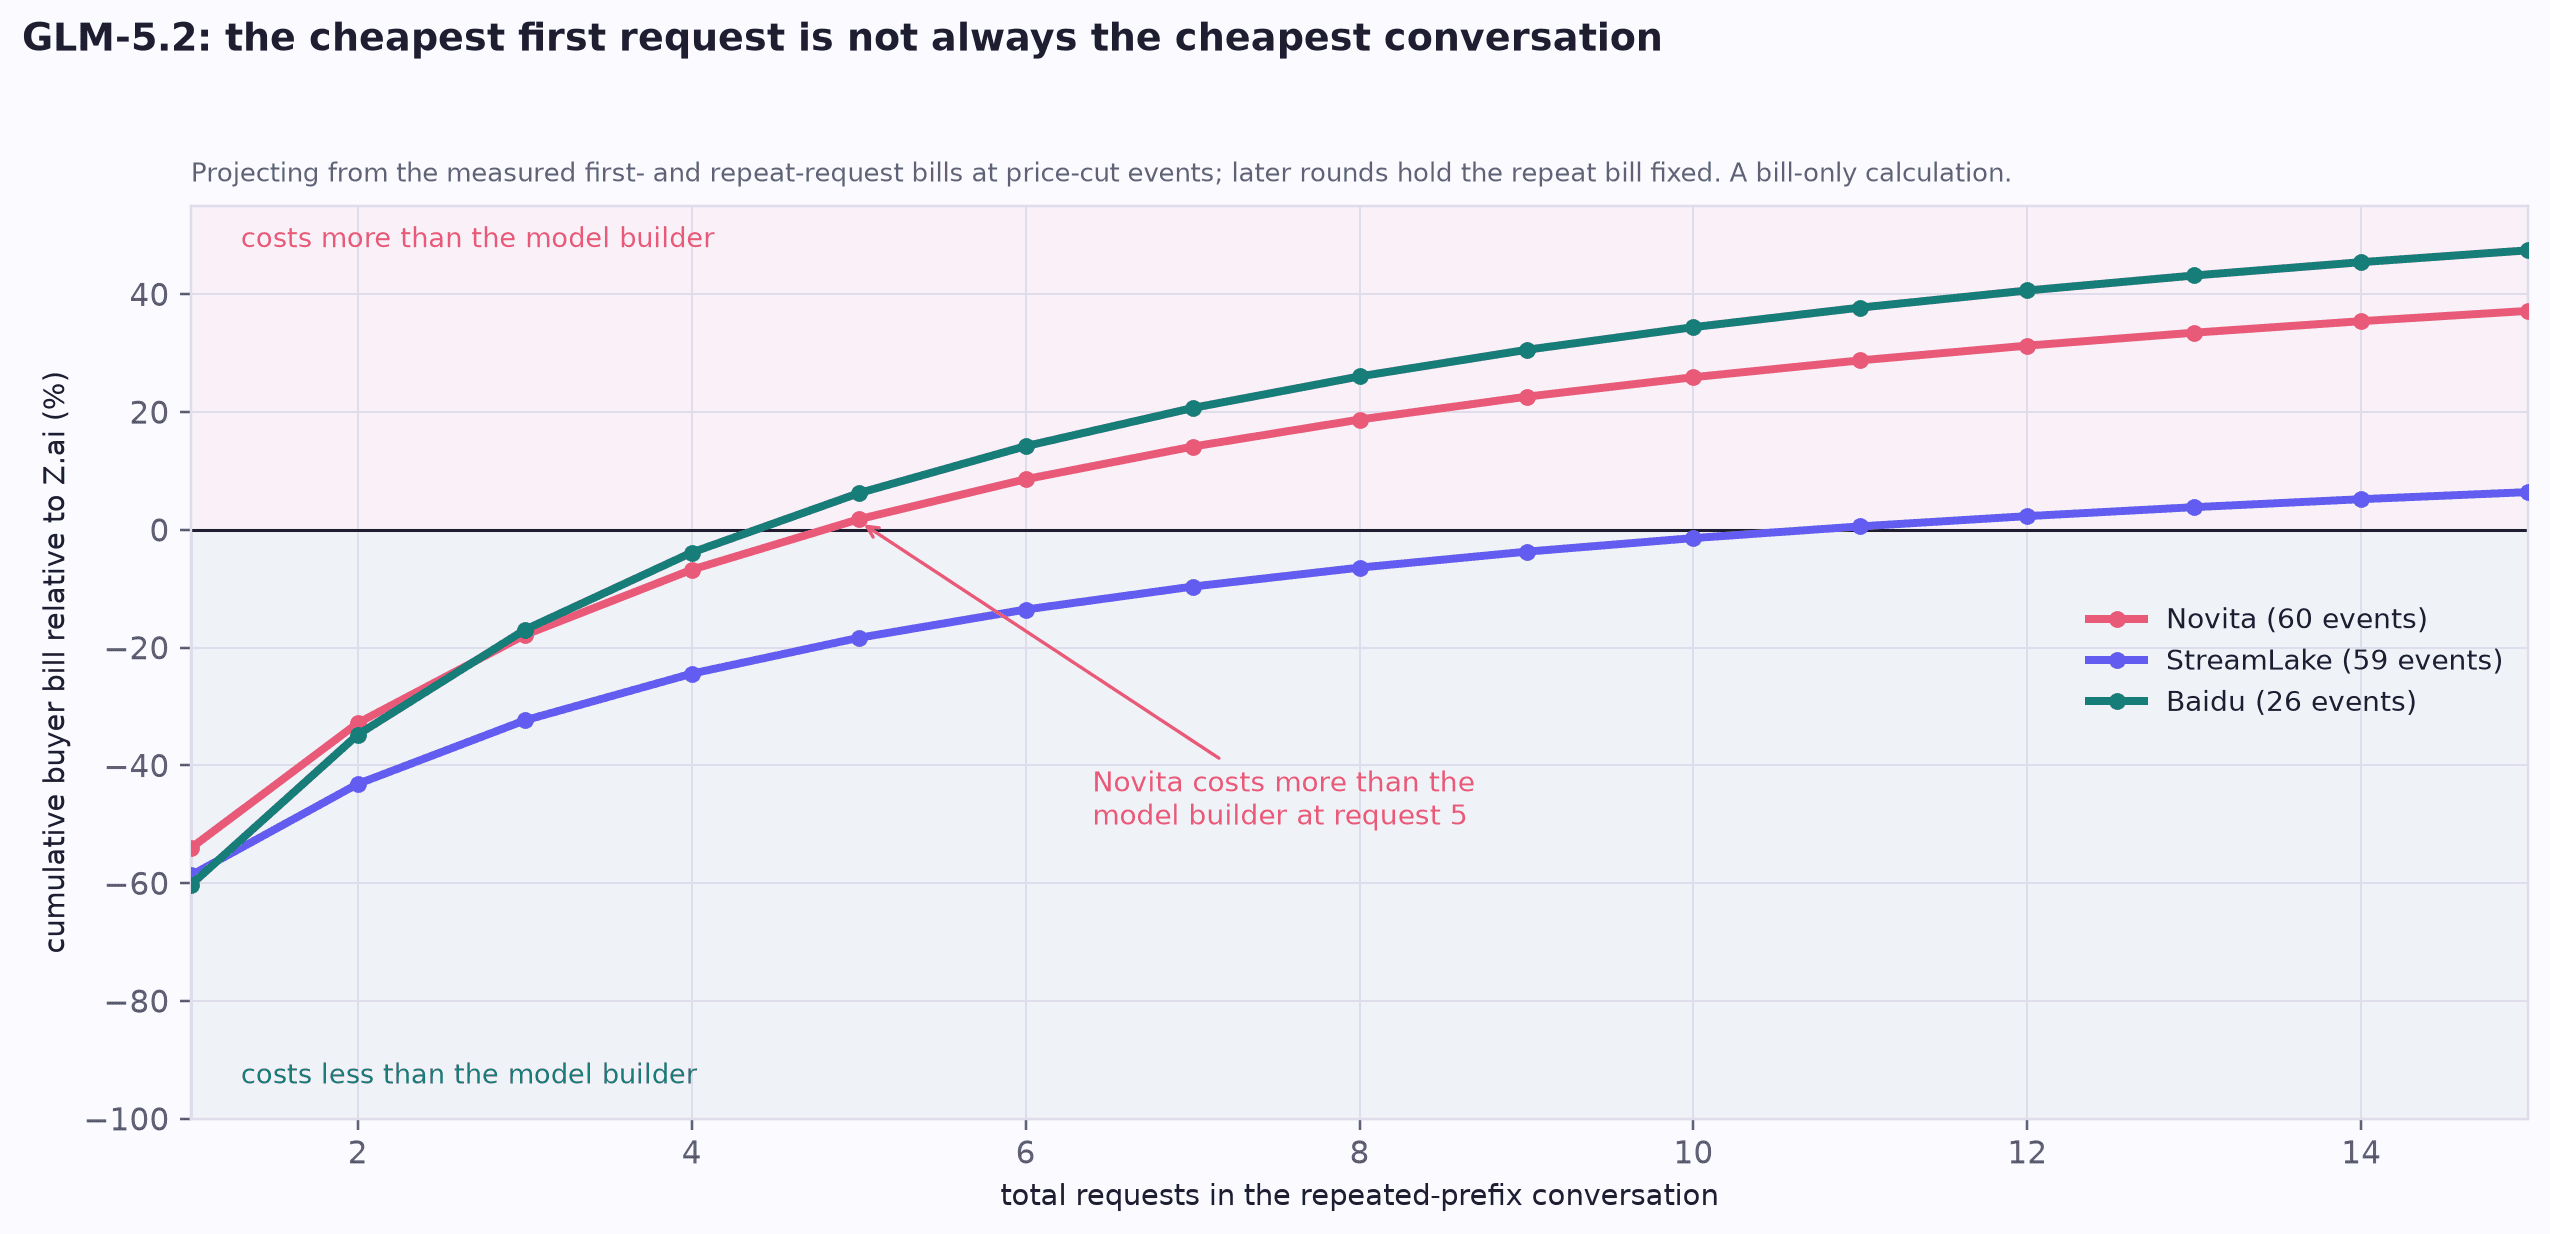
The cheapest first request is not always the cheapest conversation: projecting from observed request costs, roughly five repeated queries is where the worst repricer becomes more expensive than simply using the model builder’s endpoint
Given the large number of well-funded pricing copy pricers, a natural question to ask is, “how many repeated prompts does one need to ask a repricer before the excess that you pay for non-cached tokens is greater than using a higher quality provider endpoint?” We find that one needs roughly 5 repeated queries to the most offensive cache losing provider (Novita) before you start paying more than using the model builder’s API.
How much money could be extracted this way? We estimate the size of the prize directly from OpenRouter’s public data: for every open-weight model, the tokens a provider fails to recognize as cached, billed at the full input price instead of the cache price, summed across the market. Today the behavior extracts around $3.5 million a year, roughly 2% of OpenRouter’s revenue; if every provider used this strategy, the ceiling is on the order of $14 million a year, or 10%. The full derivation and its assumptions are in the cost appendix.

Annualized value a caching strategy could extract, over time, for GLM-5.2 alone versus every open-weight market
The maximal amount extractable has grown quickly over the weeks we can measure cleanly, tracking the growth of the open-weight market itself.
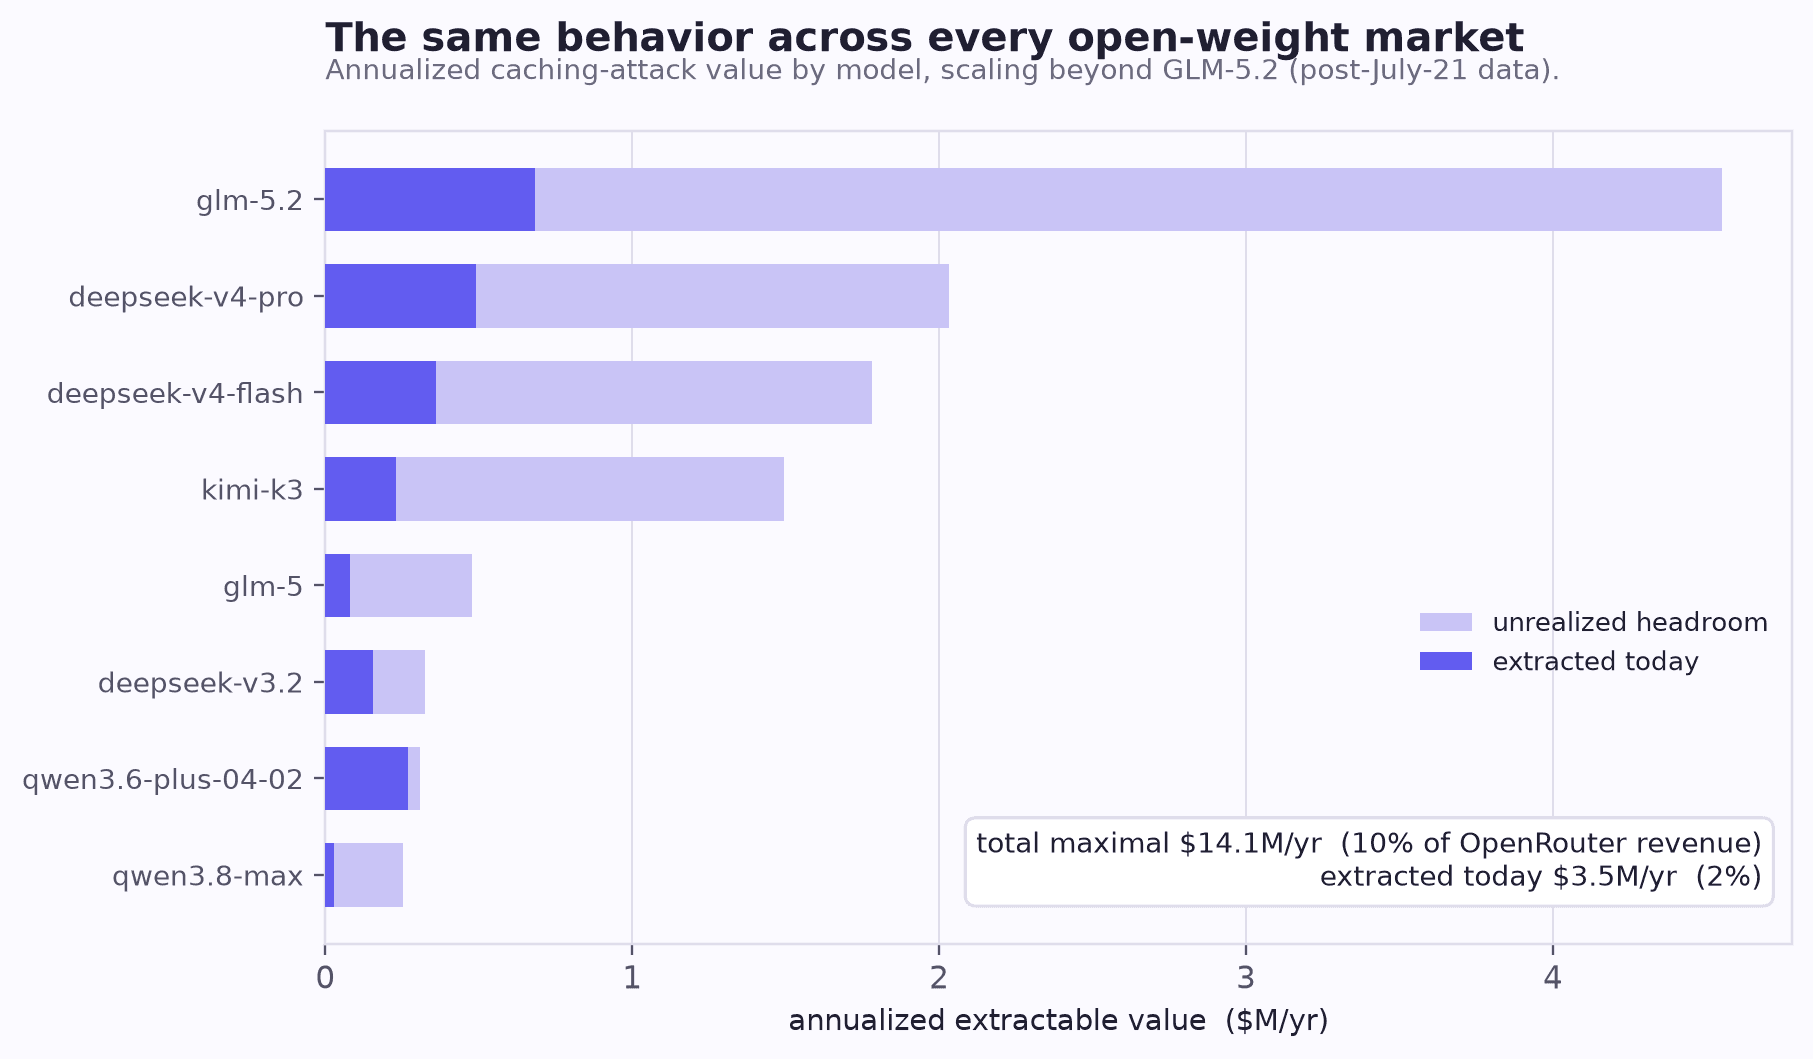
Annualized caching-attack value by model, across all open-weight markets
The amount varies across models, but a strategic provider does not have to pick one — it could aggregate the same behavior across every model it serves and realize a large profit.[19][20]
There is one more cost the contest hides, and it grows as the market matures. A warm cache is memory that only pays off where you earned it: reuse it at the provider that built it and repeated tokens are cheap; move, and the next provider charges full price to re-read everything. OpenRouter’s documented router shops the quoted price on every request and keeps no memory of where the last one went,[21] so it minimizes the price of the next token rather than the cost of the conversation. When one provider is clearly cheapest, the price-weighted draw keeps landing there and the cache stays warm; but when several providers sit close on price — exactly what a maturing market produces — the conversation is handed to whichever is a hair cheaper this instant, and every move lands cold. On GLM-5.2 we replay the public inference provider quotes under this rule: a conversation that could reuse most of its context pays 2.33 times the session-aware cost with two providers, and 3.63 times with thirty-two. Competition makes it worse, not better — more providers means more moments when a rival is a fraction of a cent cheaper, more scattering, and more warm cache thrown away. It is competition on the wrong margin.
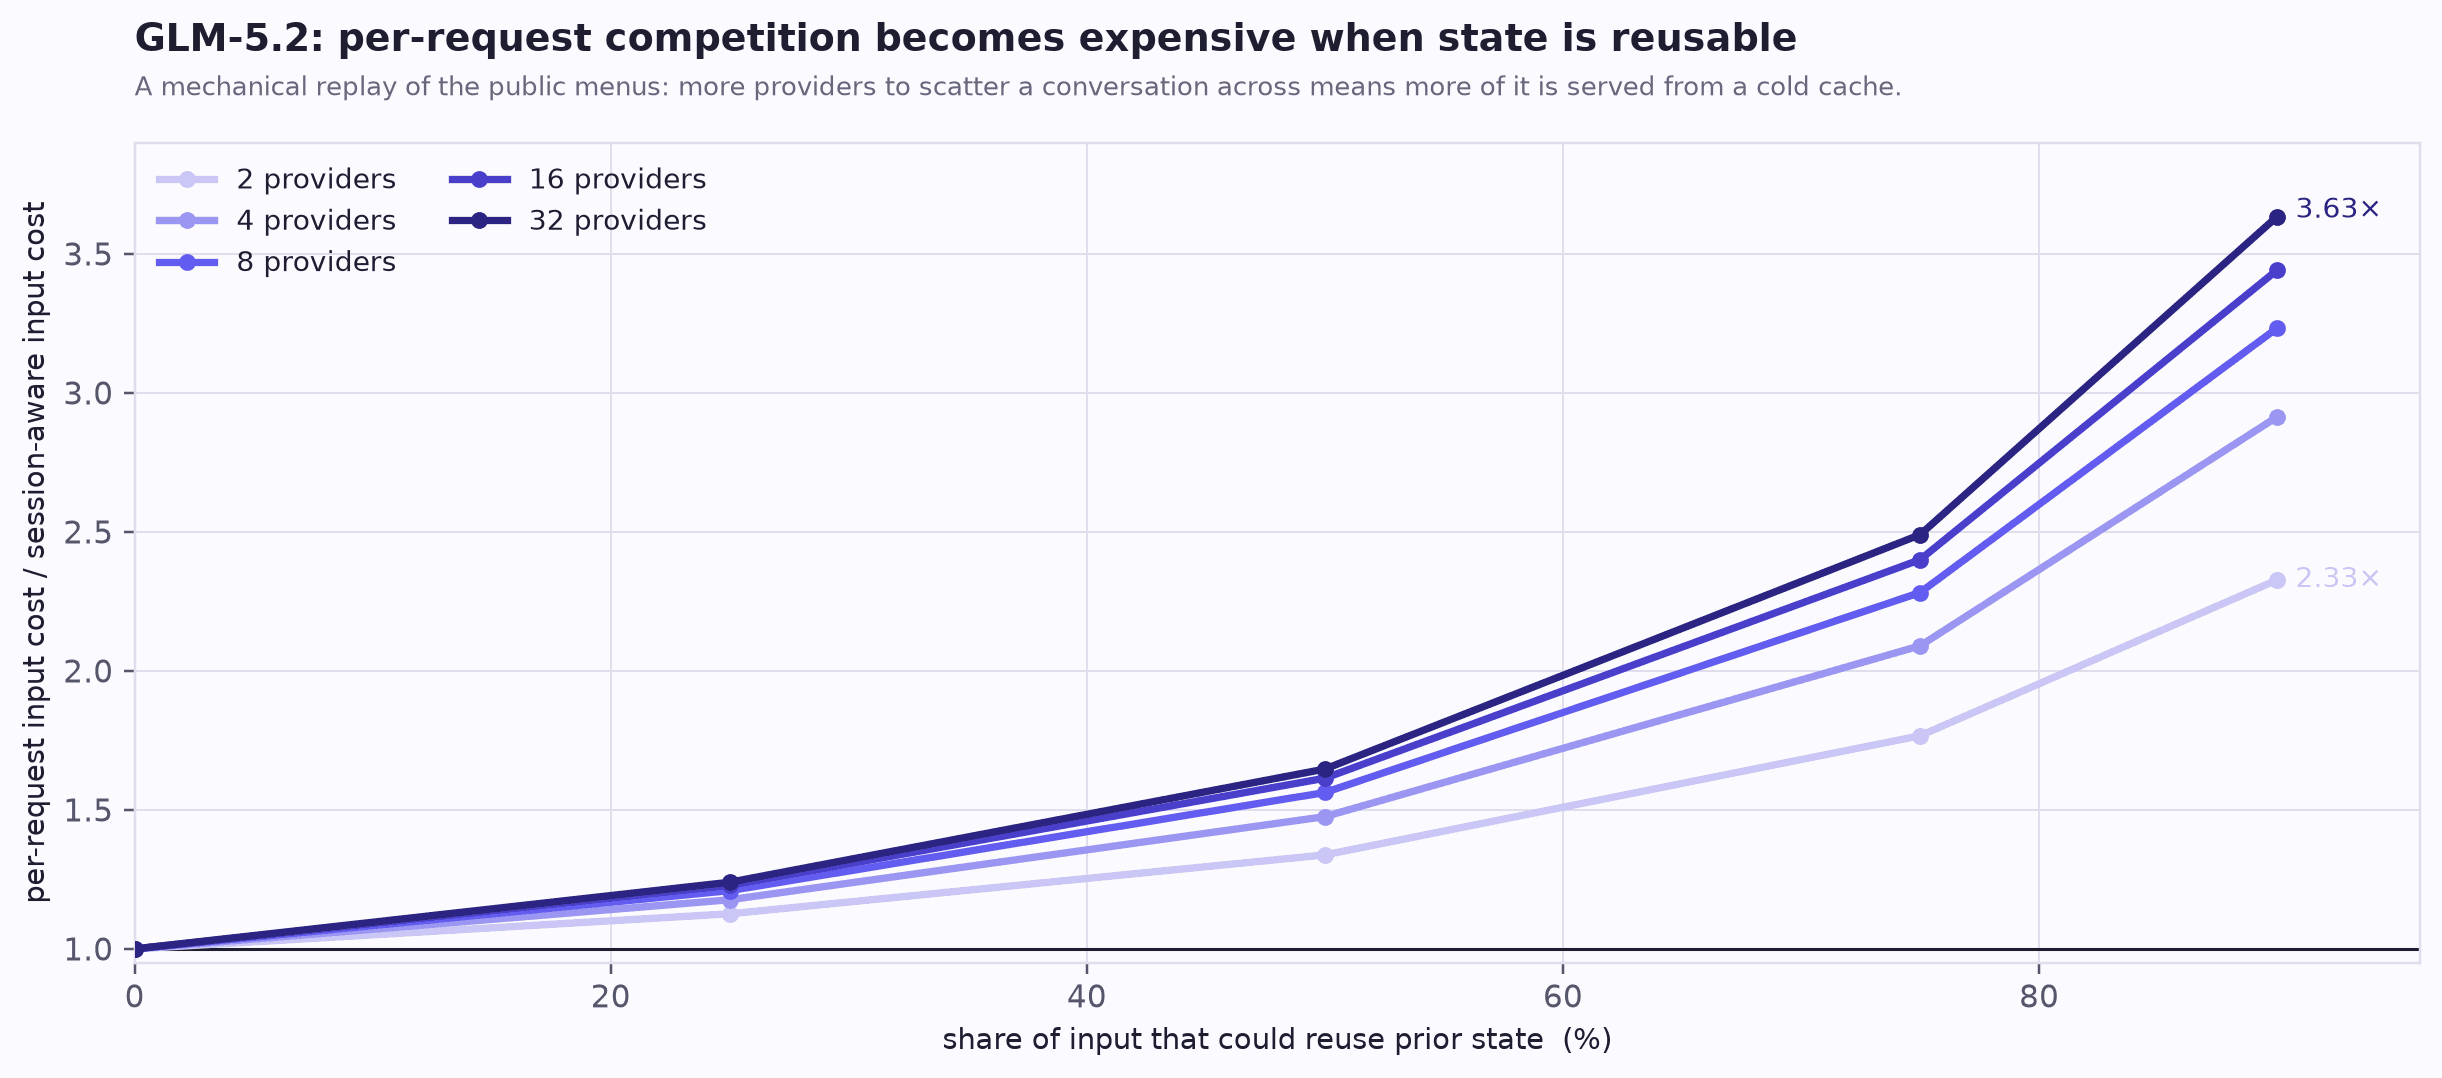
GLM-5.2 at 90% reusable context: what OpenRouter’s documented per-request routing costs a conversation, relative to an idealized router that keeps it on one warm provider, as the field grows from two providers to thirty-two. A counterfactual replay of the public inference provider quotes, not a measurement of realized routing
How can OpenRouter improve their Tullock contest?
These experiments demonstrate that there are two key flaws with the current OpenRouter Tullock contest:
The contest is implicitly state-dependent (e.g. caching acts as “state” or “memory” that the provider manipulates to increase their profit) despite the fact that the contest selection function only depends on the current pricing
The lack of ability for the purchasing user to independently verify the state used by a provider to produce tokens means they can never be completely confident that they aren’t being overcharged
The simplest fix addresses the first issue at its root: rank providers by the price a user will actually pay, not the price a provider quotes. On a workload with repeated context, the expected cost of an input token at provider \(i\) is
\[\bar{p}_i = h_i\, p_i^{C} + (1 - h_i)\, p_i^{I},\]
where \(h_i\) is the probability that a repeated token is served from cache and \(p_i^{C}, p_i^{I}\) are the provider’s cached and input prices. If the contest runs on \(\bar{p}_i\) rather than the quoted \(p_i^{I}\) — with \(h_i\) measured empirically by OpenRouter from realized billing, conditioned on session continuity and workload type — then dropping the cache is no longer free: a provider that stops recognizing repeated tokens raises its own \(\bar{p}_i\) and loses allocation. The strategy we documented becomes self-defeating, because the price the provider was manipulating is now the price the contest scores.
Short of re-pricing the contest, the same signal can be used to police it. The first issue can also be addressed by adaptively / dynamically updating the exponent and quality scores used. To do this, the router can perform repeated experiments like the ones we ran above. More specifically, one can do repeated online updates to the decisiveness of the following form:
For an observation window of duration T, send a small number of randomized canary sessions to each provider — repeated prompts with a stable session identifier, mirroring the workloads users generate organically[22]
For each provider, compare what the canaries were actually billed on repeated tokens to what the quoted cached-token price says they should have been billed; the gap is the provider’s overcharge on repeated context
Identify the providers whose overcharge is persistently larger than what ordinary cache churn (evictions, TTL expiry, redeployments) can explain
Adjust the exponent and/or lower the quality score of those providers until the gap closes
This is not exotic. Databricks’ own task router commits to a model at the start of a session precisely to preserve cache efficiency, which it calls “a critical cost driver”[23] — an explicit acknowledgment that where a session goes, and whether its cache survives, is where the money is.
The second issue, however, is more pernicious and requires deeper changes to how the router operates. For instance, if the router mandated that all KV caches had to provide cryptographic attestations (e.g. in an NVIDIA enclave) of their cached token counts, then this type of manipulation could be fully prevented. However, that would slow model performance down and/or make it harder for certain providers to compete with older hardware. As hardware for inference becomes more specialized, however, one could imagine such attestations becoming a standard to reduce marketplace manipulation and improve integrity guarantees for users.
The Future(s) of Open Intelligence
In this post, we explored how the economics of open weight models dramatically change in a world where intelligent software has to consider how much it spends on OpEx. The Souq, a nascent and emerging market built up by open model builders, routers, inference providers, and harnesses has shown immense promise in being able to dramatically lower the cost of intelligence by unbundling centralized companies. However, like most nascent markets, it is clear that a lot can be improved. We find evidence of strategic economic gaps in the largest market, OpenRouter, that allow inference providers to overcharge users. This overcharging is very similar to that found in Maximal Extractable Value in blockchains and quality shading in ad auctions. Blockchains made MEV smaller and more manageable via a combination of better mechanism design and transparent and verifiable data.[24] Ad auctions, on the other hand, utilized reputation systems and better competition amongst demand-side providers (who are somewhat analogous to routers) to reduce malicious behavior. The open weights ecosystem likely needs to use all of these elements to continue on the path to perfected router design.
However, there are many more questions to ask about the new market structure of the Souq. For instance, how do we connect the costs associated to token production (which is a ‘refined good’) more directly to the ‘raw’ inputs (e.g. hardware, energy)? Is there a sense in which the unbundled, somewhat decentralized nature of the Souq implies that token production prices can be compressed downwards to arbitrarily close to the operating expenditure of inference providers and/or neoclouds? In the next post, we will try to answer these questions by comparing the Souq to ‘refined’ product markets — like gasoline — that trade at a spread from their raw inputs (e.g. crude oil). This spread, called the crack spread in traditional commodities, usually represents both the costs of production (e.g. refining costs) as well as ‘manipulation’ (e.g. governments releasing gasoline reserves to dampen price impact in one market). We will argue that there is a similar effect in the compute markets of the Souq, where the manipulation component is the behavior we identified here and the costs of production represent amortized training costs passed on to inference users combined. We argue that while this spread is usually positive, there can be supply shocks that have it turn negative (akin to contango in oil markets or negative basis in cryptocurrencies).
Why are we going down this road? Our long-term goal is to try to understand what the terminal market structure of the Souq looks like. There are numerous companies launching products such as futures and forwards for compute. This includes exchanges (Architect, etc.), indices (Ornn, Silicon Data, Compute Desk), and brokers (Marex) for compute.[25] All of these products are built around the success of neoclouds and inference providers in building up the open source ecosystem. But the market structure and dynamics of the Souq likely implies that some of these products will be much better suited to the future of open intelligence than others.
Disclosures
The author is an investor in Together AI and Nous Research via Robot Ventures, and an angel investor in Wafer.
Appendix
GLM-5.2. In this post, we spend most of our analysis on GLM-5.2. This is because we have the best historical data for this model and because it is the most competitive market on OpenRouter. We briefly describe that here. OpenRouter had some of its largest growth when Z.ai’s near frontier GLM-5.2 was released on June 13, 2026. The large, latent demand for the model led to a large uptick in the number of inference providers and the competitiveness of inference providers, as you can see below. The spread in how widely different providers quote also grew much faster for GLM-5.2. Given this large increase in the number of providers, we found this market the most likely to have caching-based manipulation.
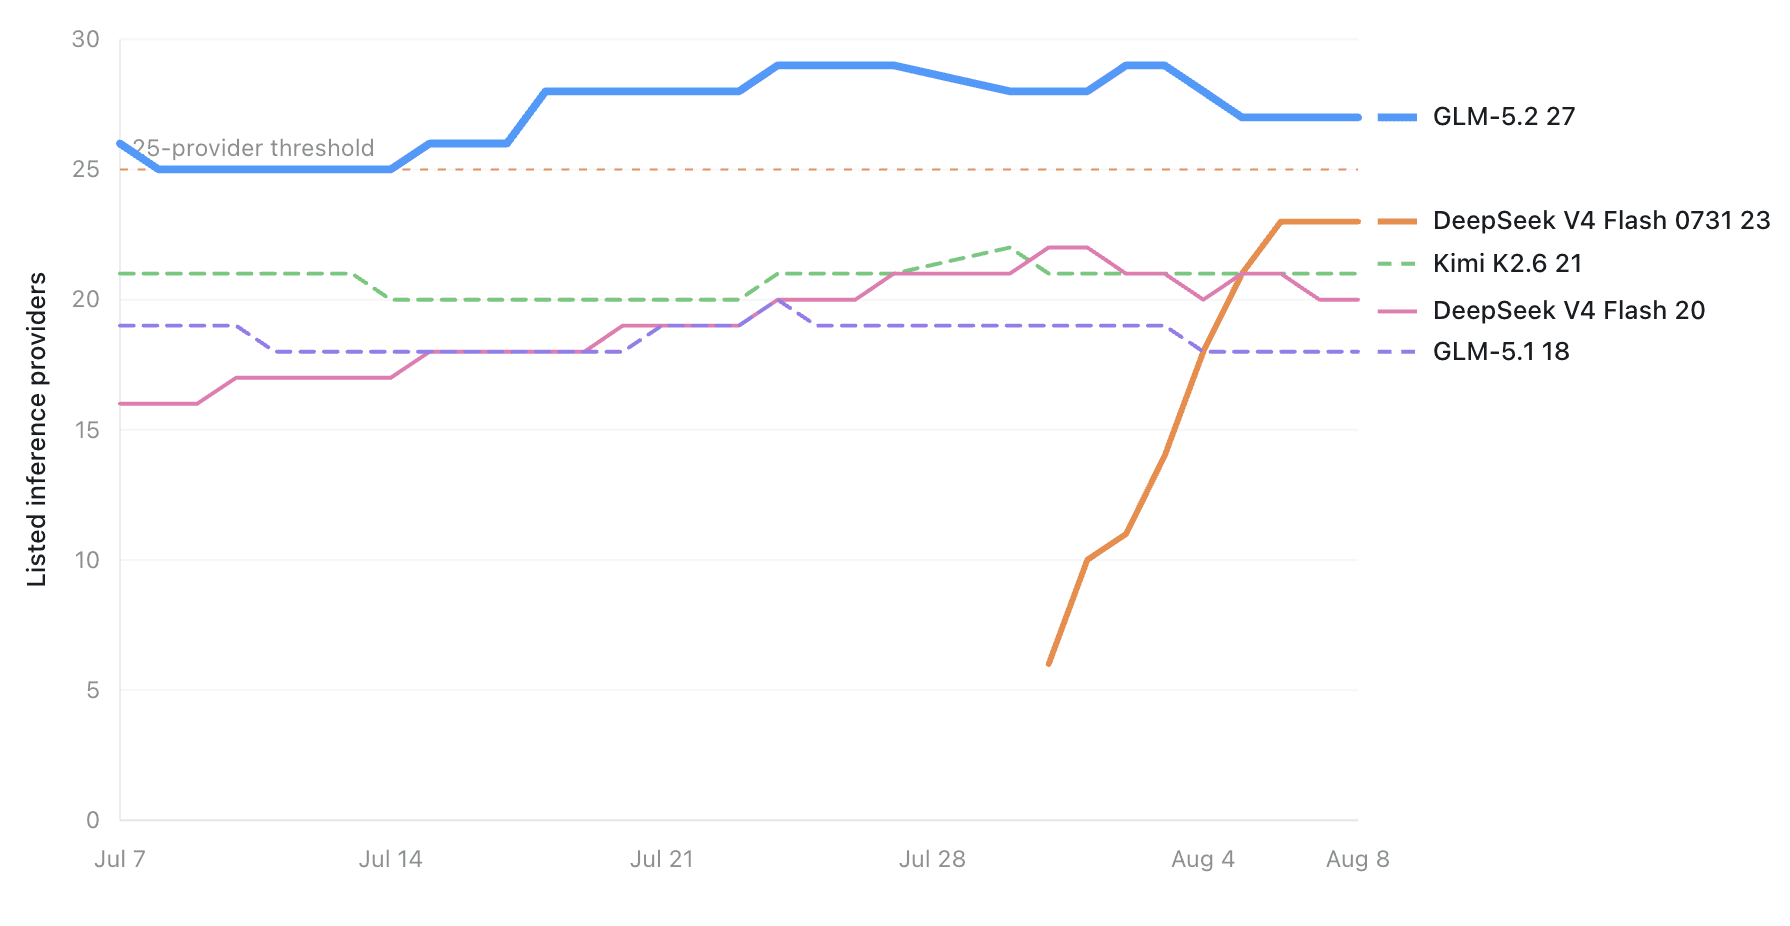
Provider entry after GLM-5.2’s release: the market deepened rapidly, which is what makes it the best venue for studying strategic pricing
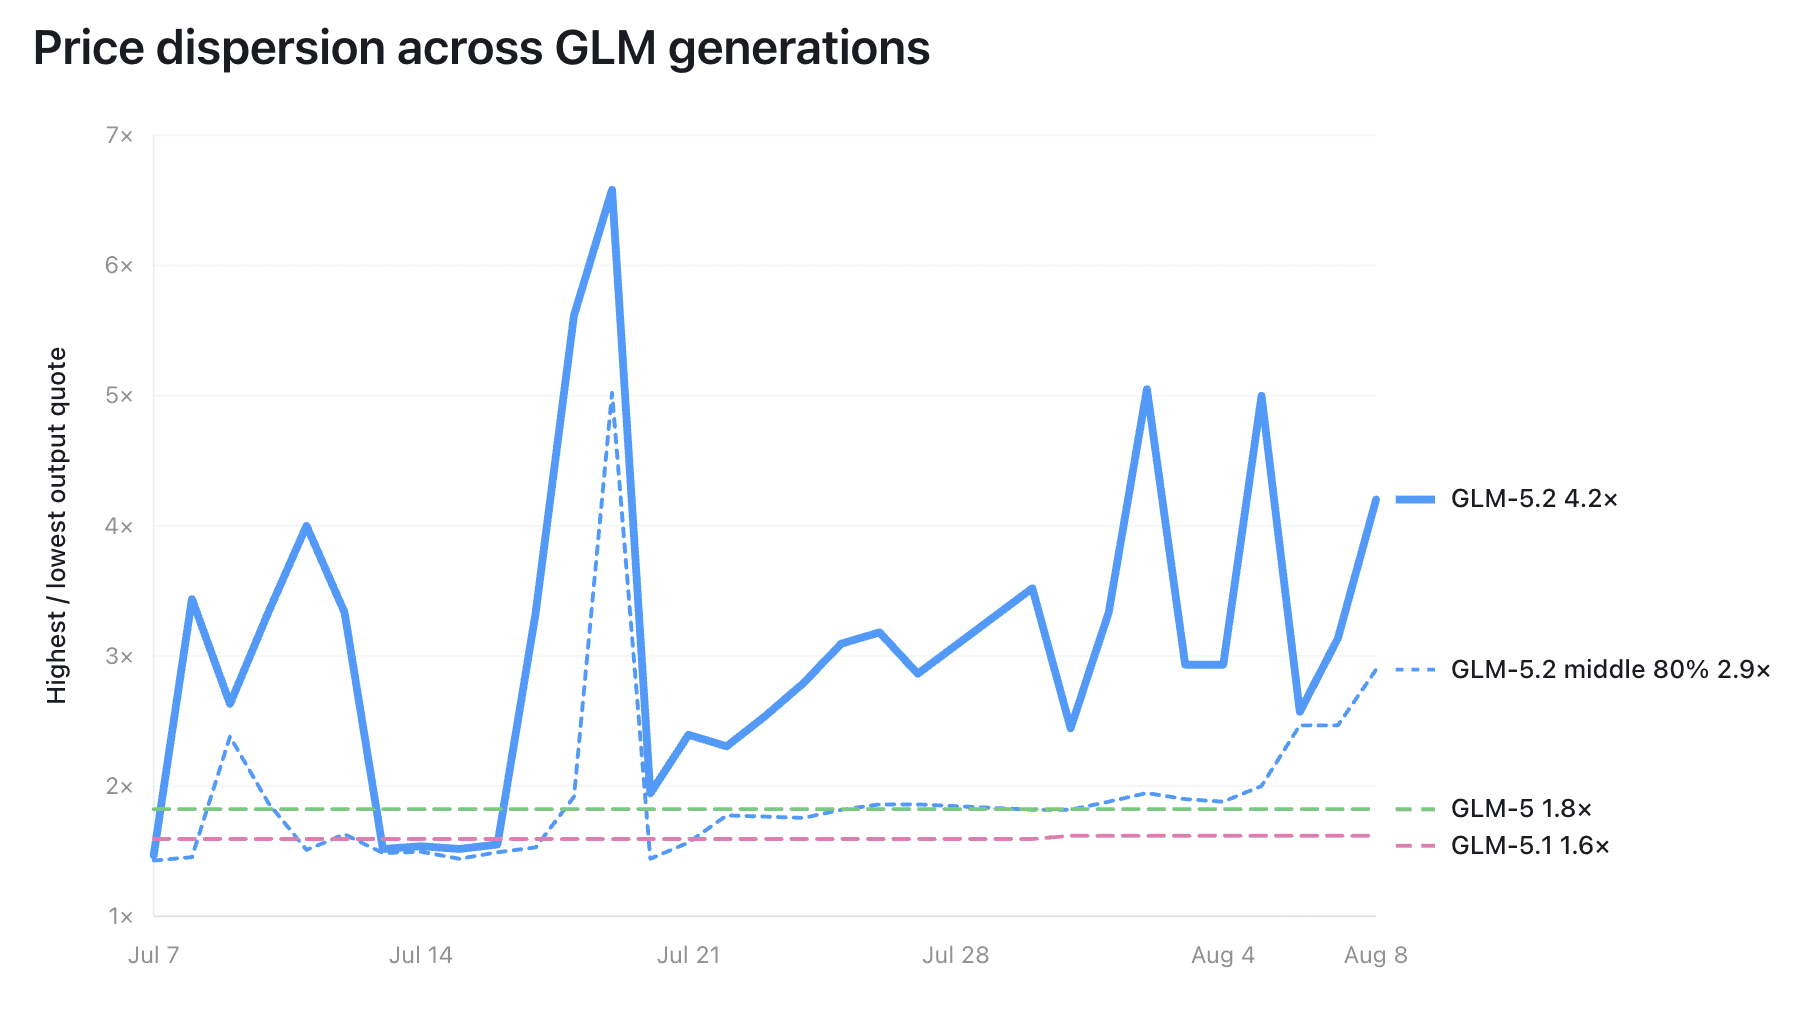
Price dispersion across GLM generations: quotes spread out much faster for GLM-5.2 than for prior generations of the model
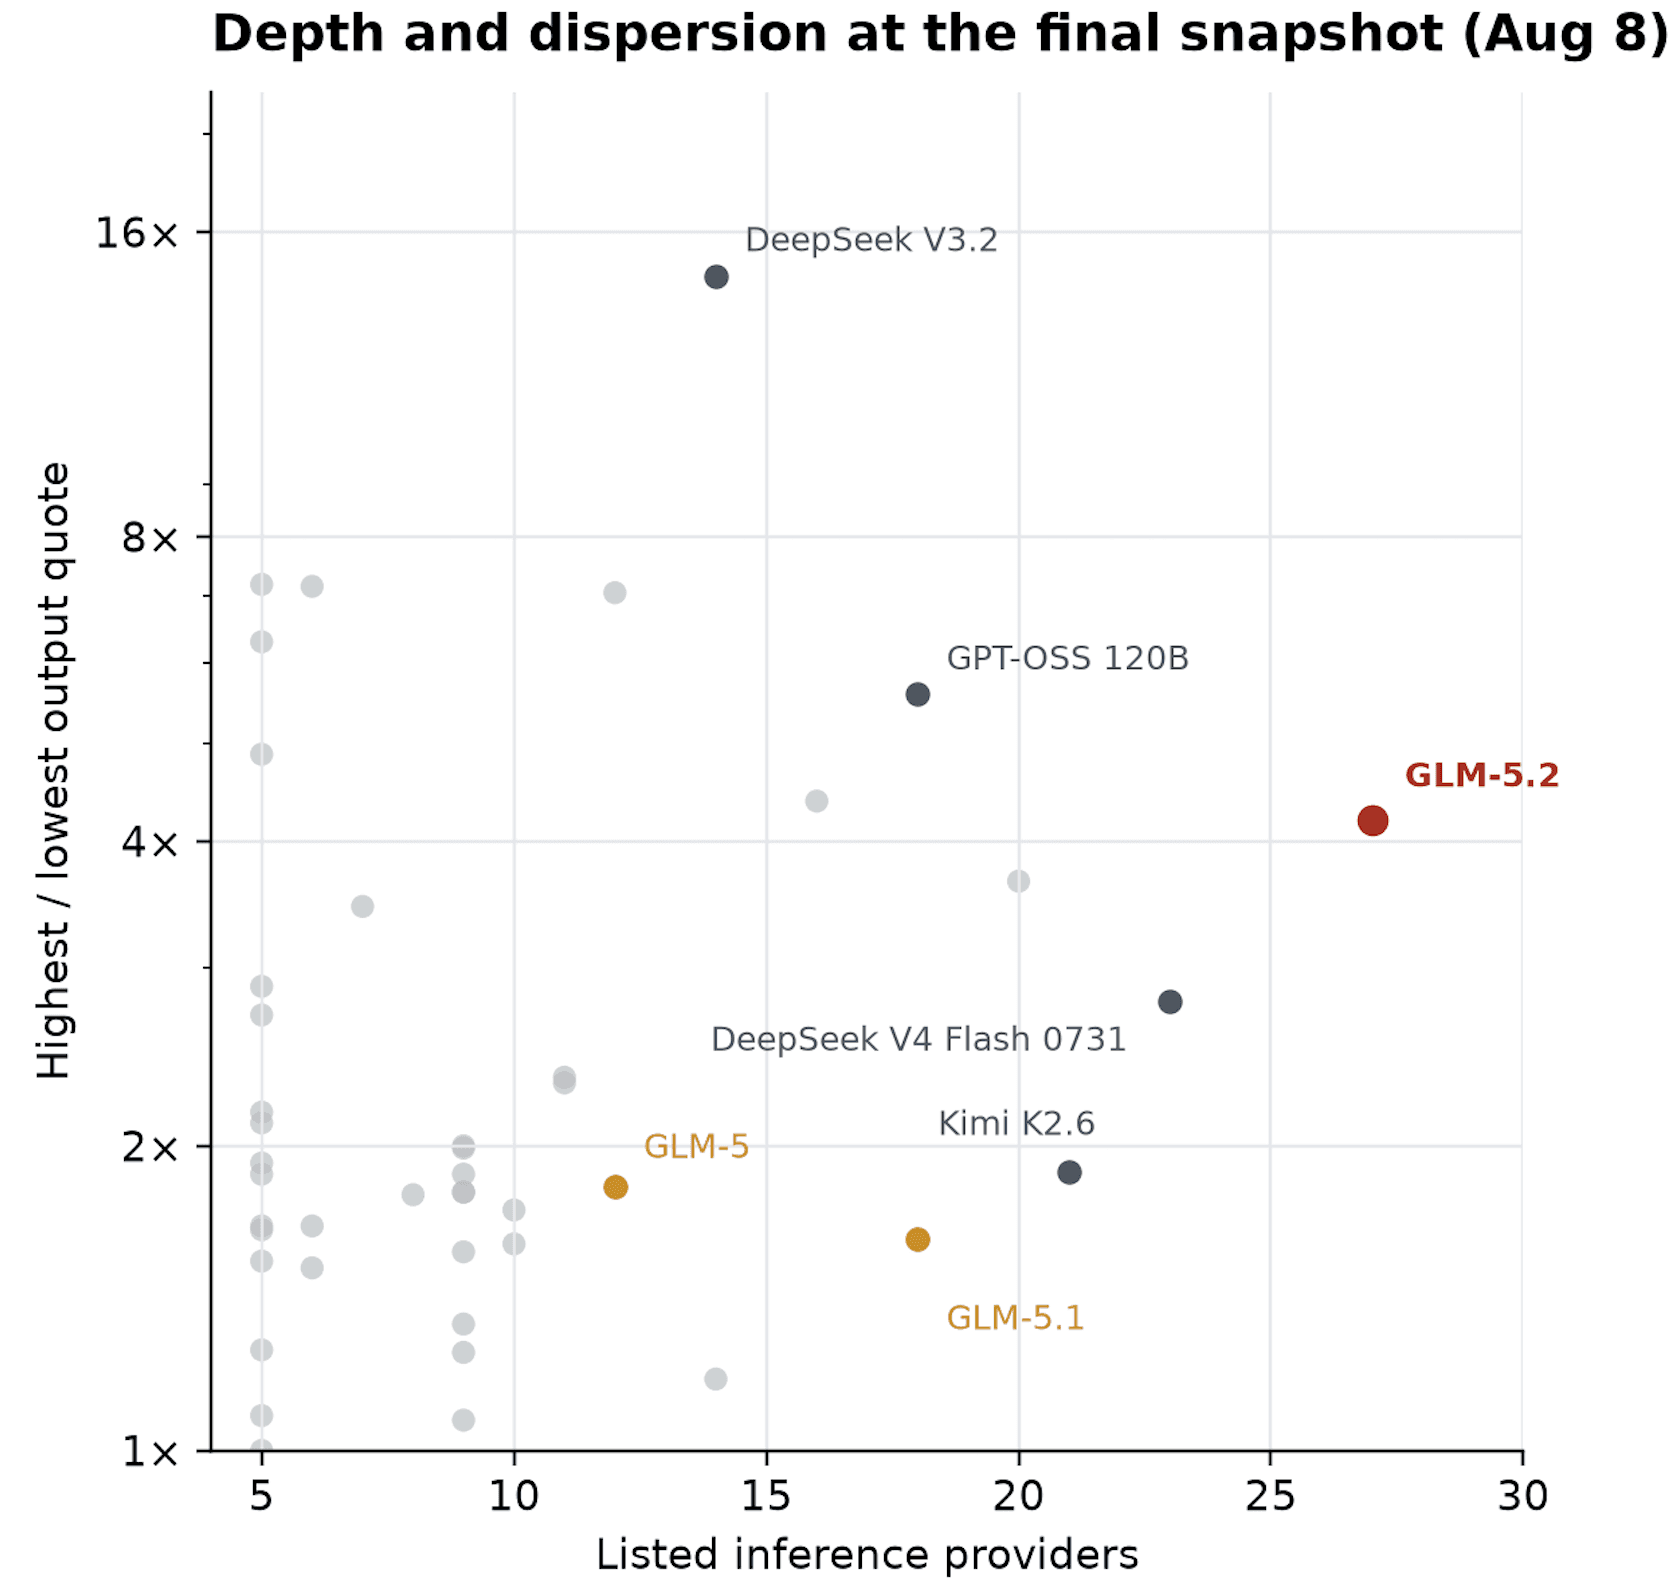
Depth and dispersion at the final snapshot (Aug 8): many providers quoting a wide range of prices — a genuinely competitive book
The price dependence of the Tullock contest
The Tullock contest in the main text scores each provider on a single price \(P_i\), but a provider quotes three prices — for input, output, and cached tokens — and OpenRouter’s documentation does not say how they combine. Everything downstream — the decisiveness \(r\), the incentive to drop cache — depends on which price the contest reads, so we pin it down two ways, from the cleanest identification to the most complete.
We measure two forms of price dependence:
Ordinal ranking: the relative ordering of the gradients \(\frac{\partial P_i}{\partial p_i^I}, \frac{\partial P_i}{\partial p_i^C}, \frac{\partial P_i}{\partial p_i^O}\). A dominant input gradient, \(\frac{\partial P_i}{\partial p_i^I} \gg \frac{\partial P_i}{\partial p_i^C}, \frac{\partial P_i}{\partial p_i^O}\), means the composite price is set mainly by the input token price.
Held-out prediction: refit the router’s choice with one of the three prices removed, and measure the change in out-of-sample prediction (e.g. log-loss, \(R^2\)).
The revealed ranking. A request sent with sort: price and fallbacks disabled forces the router to name the top of its own price ranking: whichever provider it returns is cheapest under whatever formula it runs. On most sets of inference provider quotes this reveals nothing, because there is usually one provider who is cheapest on all three prices simultaneously. The informative quotes occur when the input-cheapest and output-cheapest providers differ. We call such cases non-ordinal pricing and record quotes from inference providers on OpenRouter for most markets every five minutes and identify such cases. In 64 of 64 such non-ordinal cases across two markets (GLM-5.2 and Kimi K3), the router picked the lowest input price — including quotes where that same provider quoted the most expensive output price on the board. On Xiaomi’s Mimo v2.5 Pro it chose DigitalOcean at $0.40 per million input tokens over three rivals whose output price was $0.87 against DigitalOcean’s $1.50. Modeling the composite as \(P_i = p_i^I + w\,p_i^O\) with an output weight \(w \ge 0\), a choice is rationalized when the returned provider minimizes \(P_i\); all 64 observed choices are jointly rationalized if and only if \(w \le w^\star = 0.043\), so the router’s picks place at most about four cents of weight on a dollar of output price, the Mimo v2.5 Pro case being the binding one. Combined, this evidence strongly suggests that \(\frac{\partial P_i}{\partial p_i^I} \gg \frac{\partial P_i}{\partial p_i^C}, \frac{\partial P_i}{\partial p_i^O}\), although we need a longer observation time to show this statement with high probability rather than only in expected value terms.
The held-out prediction. Our next test to measure the dependence of \(P_i\) on \(p_i^I, p_i^O, p_i^C\) treats each default-routed request as one draw from the live allocation and asks which quoted prices predict the provider that served it. We sent several thousand such requests, each with a fresh session identifier so the draws are independent, and fit a simple Bayesian multinomial model on the quoted log-prices,
\[\Pr(i \mid \text{quotes}) \propto \exp\!\big(-\beta^{I}\log p_i^{I} - \beta^{O}\log p_i^{O} - \beta^{C}\log p_i^{C}\big),\]
on part of the data, scoring it on the rest by held-out log-loss. Dropping the cached-token price leaves that log-loss unchanged to five decimals — \(3.11040\) with and without it — and fits \(\hat{\beta}^{C}\approx 0\): the cache quote carries no out-of-sample signal we can detect. The economic reading is the one the main text leans on: the price a provider advertises for cached tokens does not move the traffic it receives, so quoting a low headline price while billing repeated tokens at the full rate costs it nothing in the contest.
We are measuring behavior, not reading OpenRouter’s source: input price is a transparent stand-in for the production formula, and we label it as such wherever we use it. The statement that the cached quote adds nothing is an identification limit, not a claim about the router’s internals — providers set their cache price as a near-fixed fraction of their input price, so the two move together, and a rule that used cache price would be indistinguishable in our data from one that ignored it. The same collinearity applies to input and output prices, which also move together across quotes: the held-out regression alone cannot separate them, and it is the non-ordinal test — where the two diverge — that isolates input. In either case the conclusion holds: reducing the input price is what wins traffic.
The caching experiments
The central claim is that a repricer bills repeated context at the fresh input price. Testing it requires separating a genuine cache miss from the benign causes that produce the same observation, so the design is as much about controls as measurements.
The market we measure against. We reconstruct the public OpenRouter market every five minutes — each provider’s input, output, and cached-token price, with reported traffic and cache use — and record the inference provider quotes immediately before and after every experiment. Any block in which the quotes changed mid-measurement is discarded; a price update in the middle of a run is otherwise easy to misread as provider behavior. When a provider changes price we freeze the event and compare its endpoint against the model builder’s — Z.ai for GLM-5.2 — with paid requests pinned to one provider and fallbacks disabled, so we measure what a buyer actually receives: the bill, the cached-token count, latency, output quality, and failures, rather than inferring any of them from the public quote. Formally, at each price-cut event \(e\) we form the paired contrast between the moving provider \(m\) and the builder \(b\) on the same repeated prompt, \(\Delta_e = s^{m}_e - s^{b}_e\), and average over events:
\[\hat{\Delta} = \frac{1}{N}\sum_{e=1}^{N}\Delta_e,\qquad N = 159.\]
Differenced this way, the moving provider recognizes 71.3 percentage points less repeated input (95% interval \([-77.1,-64.8]\)) and passes on 51.7 points less of the second-request saving (\([-56.5,-46.7]\)) than the builder at the same instant; the pairing removes anything common to both endpoints at the event.
The prompt. Each session opens with a long prompt that establishes state, then repeats related requests over several rounds. Every prompt carries text unique to its session, so nothing can be answered from OpenRouter’s own response cache — we are testing how a provider handles repeated context, not the router replaying an old answer. We run four workloads, from a deliberately transparent canary to realistic traffic:
a canary — “Here is a reference passage:
velvet velvet velvet …” (several thousand repetitions of a freshly drawn word), “reply with the single word ok” — then sent again, verbatim;a record set — a few thousand tokens of randomly generated ledger rows no two sessions share (“
id=7f3a2c amount=$412.18 …”), followed by a question about one row;a conversation — a question, the model’s answer appended, the next question on top of the growing transcript, so each turn is the last plus a little more;
an agent trace — a fixed log of tool calls (request, tool output, request) with only the final instruction changing.
In every case the opening context is unique to the session, the repeated portion is byte-identical across turns, and only the short tail is new — a provider with a working cache should recognize everything but the tail.
The treatments. Around that prompt we vary one factor at a time, and each variation also tests a benign explanation. We preserve or discard the session identifier: if misses vanish when it is held fixed, the cause was reassignment, not the cache. We mutate the prefix after 25%, 75%, or all of its content: if misses track how much we changed, the cache is keying correctly. We stretch the wait between requests: if misses appear only after long gaps, that is ordinary expiry. And because a provider sometimes cuts price after losing traffic, we check that cache behavior worsens after a price change, not before. Each treatment gets the identical prompt, timing, and output schedule at the repricer and at the model-builder endpoint, so the only difference is who served it.
Attributing the overpayment. A cache miss on a repeated token has two possible sources: the provider’s own caching behavior, or the router reassigning the conversation to a provider whose cache is cold. Separating them matters because the remedy in the main text — pricing the contest on the realized cost \(\bar{p}_i\) — is provider-side. The pinned-session experiments isolate the provider: with every request sent to one provider and the session identifier held fixed, the aggressive repricers recognize roughly ninety percent of repeated tokens, against ninety-nine percent at Z.ai, and a ten-turn conversation remains cheaper than at the model builder. Under a stable session, the repricers’ caches largely function. The overpayment we document instead arises when the session is not stable: at repricing events, and when the default router reassigns a conversation to a provider whose cache does not hold the shared prefix. The first source is a property of the provider, and is what \(\bar{p}_i\) would penalize; the second is a property of the router’s allocation, and can only be removed by preserving session continuity, as Databricks’ router does. We state which of the two each comparison identifies. The decomposition is economically significant: input and cached tokens are approximately ninety-eight percent of token volume in the GLM-5.2 market, so the billing of repeated context accounts for nearly all of what a conversation costs.
Two caveats bound these claims. First, the model builder is not a privileged benchmark — unaffiliated providers that did not train the model also recognize repeated tokens at ninety-nine percent, so a persistent cache gap is attributable to specific providers rather than to third-party status. Second, we identify an economic effect and not an intent: the experiments establish that a user persistently overpays, and that the shortfall is inconsistent with ordinary cache churn (evictions, TTL expiry, redeployments), but they cannot distinguish deliberate eviction from a poor implementation or an operational failure. This is by design, since the remedy we propose acts on the measured overcharge rather than the provider’s motive. Because repeated requests within a session are not independent draws, we compute uncertainty at the level of the pricing event rather than the individual request.
The decisiveness measurement
The contest’s decisiveness \(r\) — the exponent on price — decides whether shaving a quoted price wins a proportional slice of traffic or a super-linear one, so we estimate it from the choices the router actually made rather than from the documentation’s word. On each set of inference provider quotes the router faced, with its providers and their live prices, we model its choice as a Tullock draw,
\[\Pr(i \text{ chosen} \mid \text{quotes}) = \frac{P_i^{-r}}{\sum_j P_j^{-r}},\]
and fit the decisiveness \(r\) by maximum likelihood, pooling across every choice we observed: 1,648 of them, six models, thirty-five providers. The fit is \(\hat{r} = 1.968\), with a 95% profile-likelihood interval of \([1.82, 2.11]\), corroborated by a block bootstrap over 411 price-event blocks — the inverse-square rule the documentation implies, recovered from behavior. The fitted rule implies the cheapest provider is chosen with probability \(0.61\), \(0.49\), and \(0.40\) against one, two, and four rivals; these probabilities exceed chance only moderately because competing providers quote similar prices.
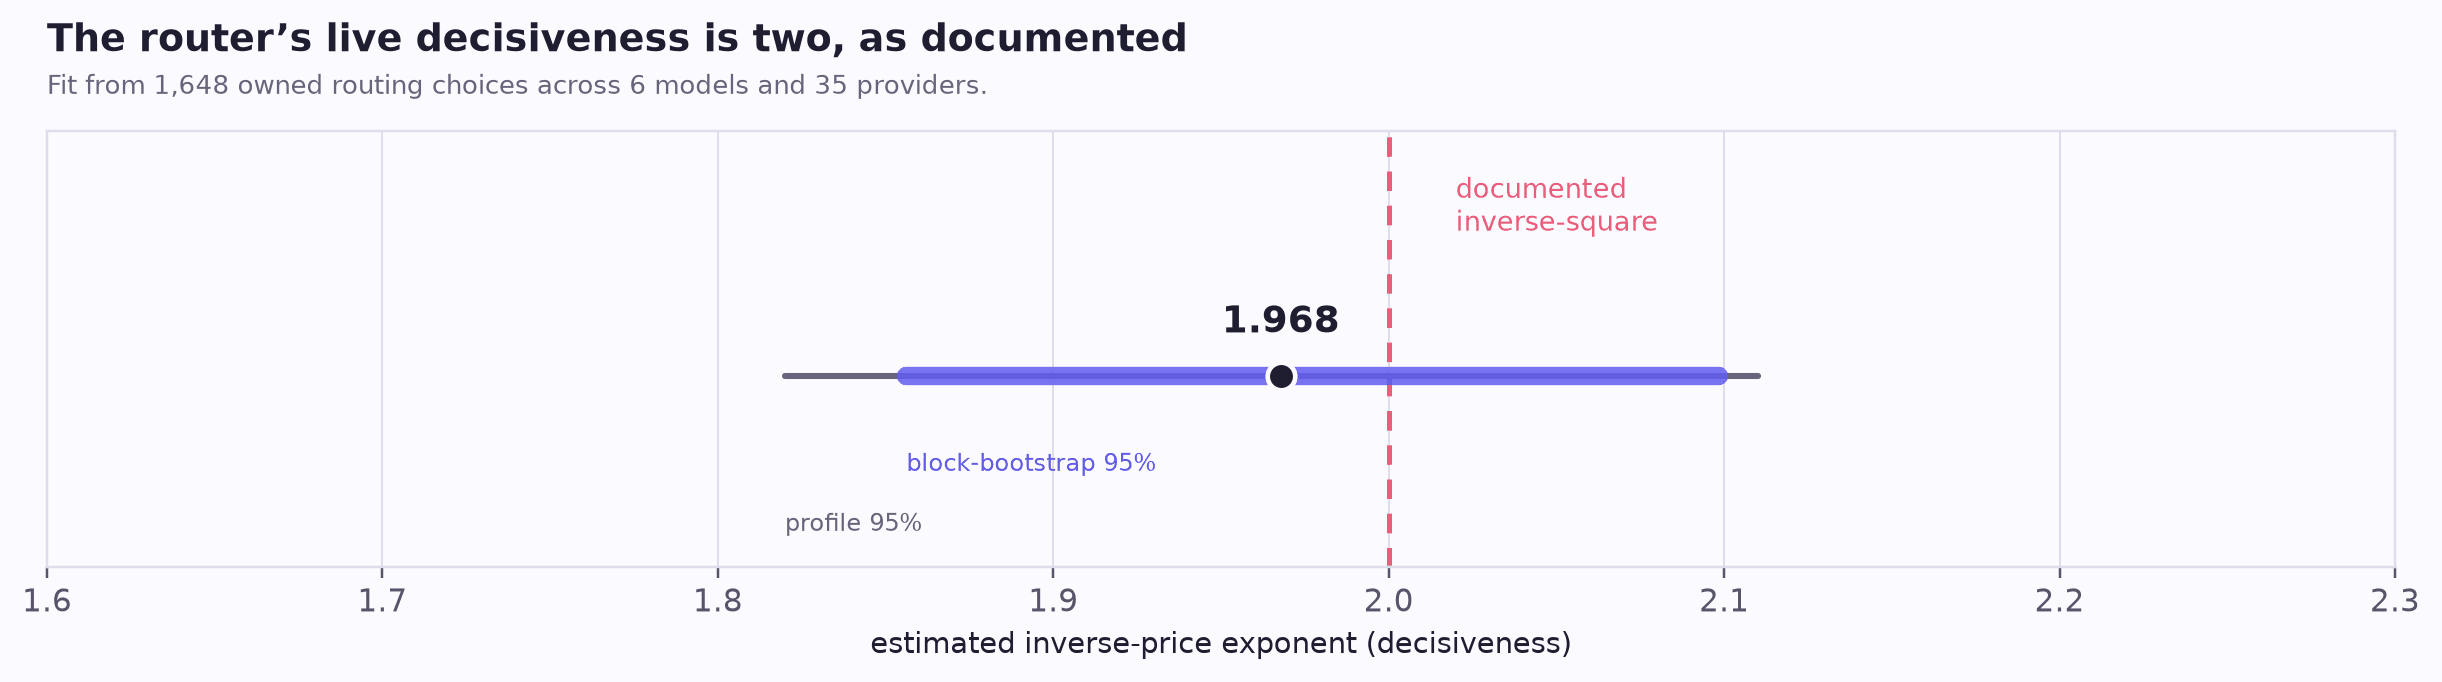
The router’s live decisiveness, fit from the providers it actually chose: 1.968 (95% profile-likelihood interval 1.82–2.11) across 1,648 choices — the inverse-square rule, as documented
A decisiveness of two makes the allocation super-linear in price: a proportional reduction in a provider’s input price produces a more-than-proportional gain in its share of order flow. This is the regime in which understating the effective price is profitable — a provider that lowers its input price by withholding cache, then bills repeated tokens at the full rate, gains share well beyond the discount it actually delivers.
The estimate is a standing property of the allocation, fit across every set of inference provider quotes we see; it is not the short-run response to any single cut. The response to one provider’s price move is noisier and decays within a day as it reaches its own capacity and the router deprioritizes it. The exponent therefore characterizes the long-run return to a low price — the quantity a provider setting its price responds to — not the impulse response to a single repricing, which is smaller and shorter-lived.
How we estimate the cost to users
We estimate a single aggregate: across OpenRouter’s open-weight markets, the total amount users overpay because providers bill repeated tokens at the fresh input price rather than the cache price. We compute it from the daily public capture, one provider–model–day at a time, and sum.
Index a provider \(i\) serving model \(m\) on day \(t\). From the capture we read the tokens it served \(V_{i,t}\), its effective input price \(p_{i,t}^{I}\) (per million tokens), and its reported cache-hit rate \(h_{i,t}\in[0,1]\). The benchmark \(h_{m,t}^{\star}\) is the token-weighted cache-hit rate of the model builder’s own endpoints for model \(m\); where the builder is not observed we set \(h_{m,t}^{\star}=0.90\) and cap it at \(0.99\). Two constants complete the calculation, and we fix them externally rather than fit them: \(\phi=0.45\), the share of a typical agentic prompt that is repeated, cache-eligible context, and \(\delta=0.90\), the fraction of the input price an honest cache discount removes — equivalently, honest caching prices a repeated token at \(p^{C}=0.10\,p^{I}\), so the discount withheld on each unrecognized token is \(\delta\,p_{i,t}^{I}=p_{i,t}^{I}-p_{i,t}^{C}\).
Writing the recognition shortfall as \(g_{i,t}=\max\!\big(h_{m,t}^{\star}-h_{i,t},\,0\big)\), the realized daily overpayment is
\[R_t=\sum_{i\,\notin\,\mathcal{B}}\phi\,g_{i,t}\,\big(\delta\,p_{i,t}^{I}\big)\,\frac{V_{i,t}}{10^{6}},\]
summed over every open-weight provider except the model builders’ own endpoints \(\mathcal{B}\), which we treat as the honest party today and hold out of the realized figure. The ceiling replaces the observed shortfall with a total one, \(g_{i,t}\equiv 1\), and drops the carve-out — it is the worst case in which no provider recognizes cache at all, including the model builders themselves, should even the honest benchmark turn malicious:
\[M_t=\sum_{i}\phi\,\big(\delta\,p_{i,t}^{I}\big)\,\frac{V_{i,t}}{10^{6}}.\]
We annualize each daily figure by \(365\) and report the current run-rate: realized overpayment on the order of $3.5 million per year (about 2% of OpenRouter’s roughly $140 million in annual revenue), and a ceiling of about $14 million per year (10%), of which GLM-5.2 alone accounts for about $5.0 million.
The most important weakness of this figure is the annualization. We observe the market cleanly only from 2026-07-21, when our capture widened roughly fifteen-fold; the earlier window is under-sampled and we drop it. The clean window is therefore only a few weeks long, and \(R_t\) is visibly non-stationary over it — the daily extractable value trends upward as the open-weight market grows (shown earlier) — so multiplying a recent day by \(365\) states today’s run-rate, not a stationary annual total; an earlier day annualizes to a smaller figure. We therefore fit the trend rather than a single point on the clean window and read the annualized numbers off its current level. Individual provider–day cells with thin volume are noisy; summing over many cells averages this down but does not remove it, and a longer, stationary window is needed before the run-rate can be reported as a confident yearly total.
The estimate also depends on the two fixed constants and the annualization window: moving \(\phi\), \(\delta\), and the window across reasonable ranges moves the ceiling between roughly $9 million and $18 million per year, so the qualitative conclusion does not depend on the precise value. Three smaller caveats remain. Our capture still sees only about a tenth of OpenRouter’s total token flow, so the aggregate, if anything, understates the market. The benchmark \(h_{m,t}^{\star}\) is available for the models constituting 92% of open-weight volume, with the conservative default above for the remainder. And this is overpayment by users, not provider profit: we do not observe providers’ costs and make no claim about their margins.
Notes
[1] Carliss Y. Baldwin and Kim B. Clark, Design Rules, Vol. 1: The Power of Modularity (Cambridge, MA: MIT Press, 2000), https://direct.mit.edu/books/monograph/1856/Design-Rules-Volume-1The-Power-of-Modularity; Yannis Bakos and Erik Brynjolfsson, “Bundling Information Goods: Pricing, Profits, and Efficiency,” Management Science 45, no. 12 (1999): 1613–1630, https://pubsonline.informs.org/doi/10.1287/mnsc.45.12.1613.
[2] Kyle Wiggers, “DeepSeek claims ‘theoretical’ profit margins of 545%,” TechCrunch, March 1, 2025, https://techcrunch.com/2025/03/01/deepseek-claims-theoretical-profit-margins-of-545/. Comparable disclosures for Minimax and Z.ai are not public.
[3] Moonshot AI, “Kimi K3 License,” July 2026, https://huggingface.co/moonshotai/Kimi-K3/raw/main/LICENSE. Model-as-a-Service operators whose aggregate revenue exceeds $20M over any twelve months must enter a separate commercial agreement with Moonshot; products above 100M monthly active users or $20M in monthly revenue must additionally display “Kimi K3” in their interface.
[4] Commodity Exchange Act § 4c(a)(5)(C), 7 U.S.C. § 6c(a)(5)(C) (prohibiting “spoofing (bidding or offering with the intent to cancel the bid or offer before execution)”), https://www.law.cornell.edu/uscode/text/7/6c; see also CFTC, “Antidisruptive Practices Authority,” Interpretive Guidance and Policy Statement, 78 Fed. Reg. 31890 (May 28, 2013), https://www.govinfo.gov/content/pkg/FR-2013-05-28/pdf/2013-12365.pdf.
[5] Benjamin Edelman, Michael Ostrovsky, and Michael Schwarz, “Internet Advertising and the Generalized Second-Price Auction,” American Economic Review 97, no. 1 (2007): 242–259, https://www.aeaweb.org/articles?id=10.1257/aer.97.1.242; on buyers receiving counterfeit or lower-quality impressions than promised, Muhammad Ahmad Bashir et al., “A Longitudinal Analysis of the ads.txt Standard,” Proc. ACM IMC ’19 (2019), https://doi.org/10.1145/3355369.3355603. The auction operator itself can be the manipulator: in United States v. Google LLC (E.D. Va., April 17, 2025), the court found Google monopolized the open-web display ad-exchange and publisher ad-server markets, with trial evidence that Google preferenced its own exchange in the auctions it ran, https://en.wikipedia.org/wiki/United_States_v._Google_LLC_(2023).
[6] Irena Gao, Percy Liang, and Carlos Guestrin, “Model Equality Testing: Which Model Is This API Serving?” (ICLR 2025), https://arxiv.org/abs/2410.20247, which found 11 of 31 commercial endpoints serving distributions that differ from the reference Llama weights; see also Moonshot AI’s K2 Vendor Verifier, https://github.com/MoonshotAI/K2-Vendor-Verifier, which benchmarks third-party Kimi API vendors against the official endpoint.
[7] What the industry calls routing is, economically, a two-sided matching problem: capability matching pairs tasks with models, and execution matching pairs requests with inference providers. For the classical theory of matching markets, see David Gale and Lloyd S. Shapley, “College Admissions and the Stability of Marriage,” American Mathematical Monthly 69, no. 1 (1962): 9–15, https://doi.org/10.2307/2312726; and Alvin E. Roth and Marilda A. Oliveira Sotomayor, Two-Sided Matching (Cambridge University Press, 1990). On OpenRouter, capability matching is opt-in — by default the application names its model and the router performs only execution matching.
[8] Individual routers implement, combine, or skip these stages — on OpenRouter, capability routing is opt-in (openrouter/auto); by default an application names its model and only execution routing runs. See https://openrouter.ai/docs/guides/routing/routers/auto-router.
[9] Uber, “Scaling GenAI at Uber with the GenAI Gateway,” https://www.uber.com/us/en/blog/genai-gateway/; Grab, “Grab AI Gateway,” https://engineering.grab.com/grab-ai-gateway; LinkedIn, “Behind the Platform: The Journey to Create the LinkedIn GenAI Application Tech Stack,” https://www.linkedin.com/blog/engineering/generative-ai/behind-the-platform-the-journey-to-create-the-linkedin-genai-application-tech-stack; Expedia Group, “Gateways, Guardrails and GenAI Models,” https://medium.com/expedia-group-tech/gateways-guardrails-and-genai-models-aa606379164d; Instacart, “Simplifying Large-Scale LLM Processing across Instacart with Maple,” https://tech.instacart.com/simplifying-large-scale-llm-processing-across-instacart-with-maple-63df4508d5be; Palantir, “LLM Capacity Management,” https://www.palantir.com/docs/foundry/aip/llm-capacity-management.
[10] Arena (formerly LMArena/Chatbot Arena), https://arena.ai. Methodology: Wei-Lin Chiang et al., “Chatbot Arena: An Open Platform for Evaluating LLMs by Human Preference” (ICML 2024), https://arxiv.org/abs/2403.04132.
[11] “More expensive to manipulate” in the precise sense that raising the decisiveness exponent raises the equilibrium expenditure required to move the allocation: rent dissipation increases in the exponent, reaching full dissipation of the contested rent for exponents above two. Gordon Tullock, “Efficient Rent Seeking,” in Toward a Theory of the Rent-Seeking Society (Texas A&M University Press, 1980), 97–112; Michael R. Baye, Dan Kovenock, and Casper G. de Vries, “The Solution to the Tullock Rent-Seeking Game When R > 2,” Public Choice 81 (1994): 363–380, https://personal.eur.nl/cdevries/Articles/publicchoicesolutiontullock.pdf.
[12] Technically there is a fourth quoted price for per-request/per-image pricing.
[13] Gordon Tullock, “Efficient Rent Seeking,” in Toward a Theory of the Rent-Seeking Society, ed. James M. Buchanan, Robert D. Tollison, and Gordon Tullock (College Station: Texas A&M University Press, 1980), 97–112; Kai A. Konrad, Strategy and Dynamics in Contests (Oxford: Oxford University Press, 2009), https://global.oup.com/academic/product/strategy-and-dynamics-in-contests-9780199549603; Luis C. Corchón and Marco Serena, “Contest Theory,” in Handbook of Game Theory and Industrial Organization, Volume II (Cheltenham: Edward Elgar, 2018), 125–146, https://www.elgaronline.com/edcollchap/edcoll/9781788112772/9781788112772.00013.xml.
[14] OpenRouter, “Provider Selection,” https://openrouter.ai/docs/guides/routing/provider-selection. The default load balancer selects among providers with weight proportional to the inverse square of price, deprioritizing providers with recent outages.
[15] This is the false-name manipulation familiar from mechanism design: any allocation that is additive across identities and super-linear in effort rewards splitting one identity into several. In a mechanical replay of GLM-5.2’s public inference provider quotes, ten economically identical duplicate endpoints raise an owner’s share by roughly four times. We see no evidence a provider does this today; the natural fix is to aggregate by owner — or by delivery grade — rather than by endpoint.
[16] The composite price is not explicitly defined in OpenRouter’s documentation; we measure it with deterministic price-sorted requests and by predicting default-routed choices from the quoted prices. See the methodology appendix.
[17] Winning today to be the incumbent tomorrow is the classic switching-costs logic: Paul Klemperer, “Markets with Consumer Switching Costs,” Quarterly Journal of Economics 102, no. 2 (1987): 375–394, https://academic.oup.com/qje/article-abstract/102/2/375/1922549.
[18] The claim boundary: when we pin requests to a repricer and hold a session identifier fixed, its cache mostly works — roughly ninety percent of repeated tokens are recognized. The failures concentrate at repricing events and provider switches. Distinguishing a deliberate eviction policy from an operational one would require provider internals we do not have; the billing consequences do not depend on the distinction.
[19] This projection holds later-turn costs at the observed second-request level; directly measured multi-turn pinned sessions are in progress and will replace this extrapolation.
[20] A visible headline price with an economically important, less-salient continuation cost is the shrouded-attributes pattern: Xavier Gabaix and David Laibson, “Shrouded Attributes, Consumer Myopia, and Information Suppression in Competitive Markets,” Quarterly Journal of Economics 121, no. 2 (2006): 505–540, https://academic.oup.com/qje/article/121/2/505/1884013.
[21] OpenRouter, “Provider Selection,” https://openrouter.ai/docs/guides/routing/provider-selection. The default load balancer selects among providers with weight proportional to the inverse square of price, deprioritizing providers with recent outages.
[22] We originally considered comparing the distribution of payments to the Tullock distribution implied by quoted prices (e.g. via KL divergence). We dropped it: payment shares differ from request shares whenever expected bills differ across providers, so a positive divergence arises under fully honest, heterogeneous pricing — it cannot identify shading.
[23] Databricks, “Smart Routing in Unity AI Gateway: Match Frontier Quality at 30% Lower Cost Per Task,” 2026, https://www.databricks.com/blog/smart-routing-unity-ai-gateway-match-frontier-quality-30-lower-cost-task. Its router assesses task complexity at the start of a session and commits to a model for the session’s duration, explicitly to preserve provider-side cache efficiency.
[24] Via proposer–builder separation: Flashbots, “MEV-Boost: Introduction,” https://docs.flashbots.net/flashbots-mev-boost/introduction.
[25] Architect Financial Technologies, press release, May 28, 2026, https://www.prnewswire.com/news-releases/architect-financial-technologies-to-launch-us-futures-exchange-for-compute-and-ai-commodities-following-dcm-acquisition-302784564.html; ICE and Ornn, press release, May 19, 2026, https://ir.theice.com/press/news-details/2026/ICE-and-Ornn-to-Launch-GPU-Compute-Futures-Contracts/default.aspx; CME Group and Silicon Data, press release, May 12, 2026, https://www.silicondata.com/news-room/cme-group-and-silicon-data-partner-to-launch-first-compute-futures; Compute Desk (The Compute Index, Inc.), https://www.compute-desk.com/.

Robot Ventures
